Gap Analysis is taking the price action of the gap and determining if price support/demand exists or if price resistance/supply exists.
For example, if a stock gaps down and you look to the left and see price support/demand, there is a higher probability that stock will find buyers in that area to defend that price. If it doesn’t have price support/demand, it should keep moving until it reaches a confirmed key area of support/demand.
KEY QUESTION
The first question I ask myself as a gap trader is, “Is this gap down at price support/demand?” If it is not then I would look to identify that area of price support/demand and mark it off. That area will become my first potential target if I get short this stock.
UNDERSTAND SUPPORT
As both a day trader and swing trader, understanding support level has become a key to my success. I have found that a lot of traders find an entry off a pattern and think they have a golden trade. However, they fail to realize that they must also have a definable target to equal the quality of the entry to make it a golden trade.
STACK THE ODDS IN YOUR FAVOR
Remember, it is important to stack all the odds in your favor as much as possible as this will give you an edge above the sea of losing traders.
AN EXAMPLE
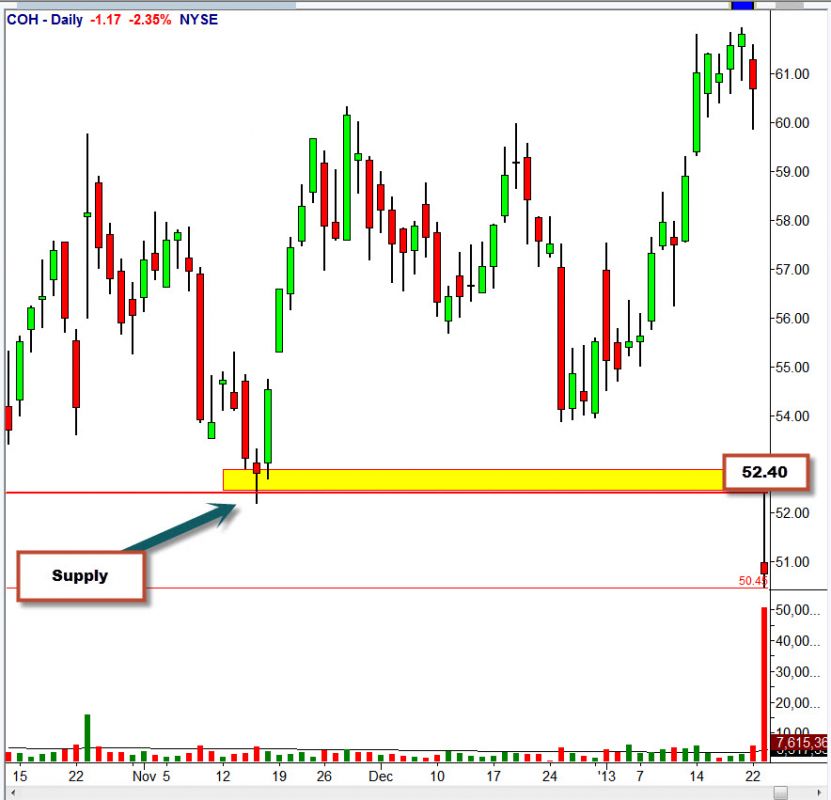
Let’s look at a gap down example. Coach Inc. (COH) gapped down on January 23, 2013 under a key support/demand area which was $52.50. I identify that the nearest support/demand level is at $48.00 off the daily chart.
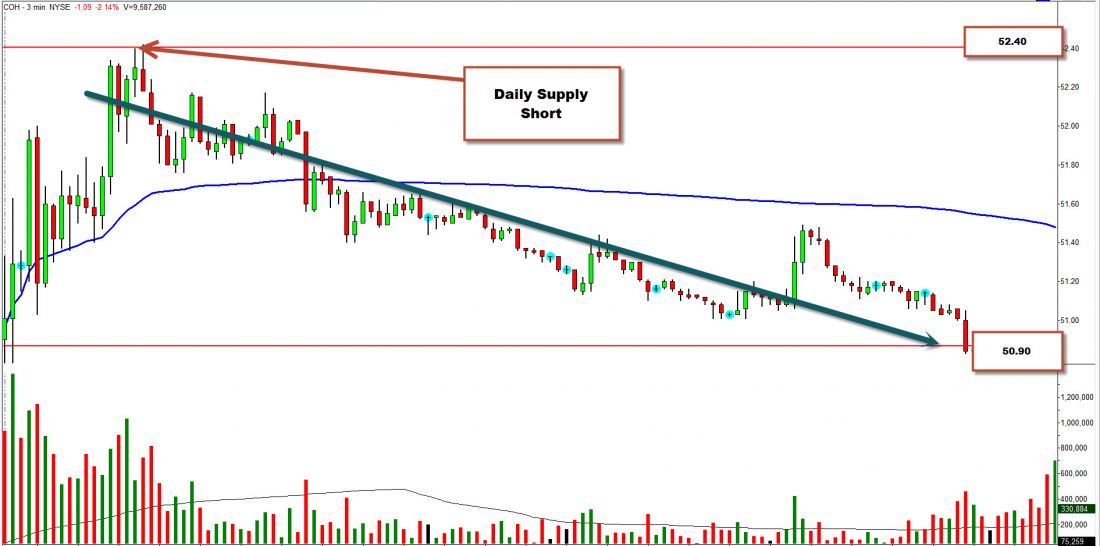
Now I am getting excited. I see I could have a big trade going on here. Should I short the open and get a fast drop into $48.00? Now I know supply exists overhead but the stock has gapped far away from this area and is opening at $50.98.
TOP DOWN
I wait like a trained marksman shooter waiting for his target to get right into his sight at $52.40 and take a short entry off confirmed supply off the larger timeframe. I always teach and coach my traders to identify an area first and then wait to see if they get a pattern in that area. See the charts below one showing the larger time frame which gave an entry on the smaller time frame.


= = =


