

How do you know when to fade a stock that gaps up?
Kinder Morgan Inc. (KMI) gapped up $6.00 on August 11, 2014 and this is a great example of what you should look for to get a fade going.
Your Edge
Since I am a price action trader I need price action to determine what I should do with KMI. The only data I have before the open is the premarket data showing me the gap up. This is a great place to start and this data can give you an edge if you pay attention to what’s going on.
KMI Action
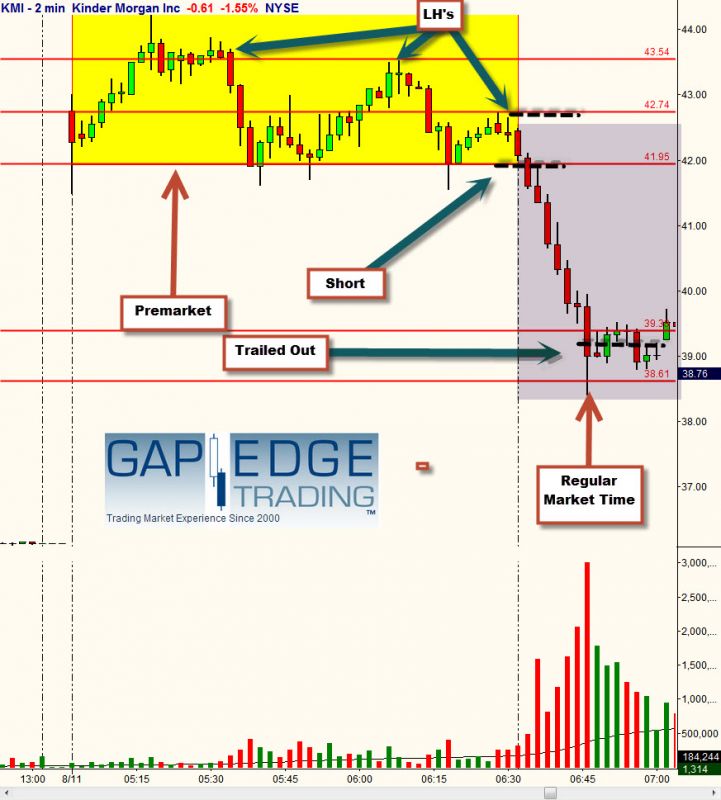
KMI premarket open ran from $41.49 to $44.21 before it started to run out of steam. On the two-minute chart it made its first lower high at $43.88 and then fell hard below the premarket low at $41.62. It retraced back up to $43.54 and made another lower high showing you that sellers were selling the rallies. Right before the open it made its third lower high at $42.74 and then opened at $42.41. Sellers were dumping the stock before the open so the odds favored the shorts. I personally used the second two-minute bar for my entry to get short at $41.95 with my stop just over the high of the day at $42.75 giving me a Risk of .80. I had no guarantees it was going to work and I wanted to control my risk.
Immediately, the fade on KMI started working very nicely which alerted me into trade mode on the two-minute bar going bar by bar until it broke a previous bars high upon which I tried to remain full size on the trade for maximum profit. I ended up trailing out at $38.70 on a big panic drop bar for 4.06 R’s my risk amount. [Risking .80 from entry to stop which is One R (risk unit) and making 3.20 equals 4 R’s.]
Increase Your Odds
A tip on trading fades on gaps is to look at early premarket trading action to determine weakness or strength. Trading against uncertainty and trying to stalk the odds in your favor is the name of the game.
= = =
Learn more about Gap Edge Trading here.

