

Given the big decline in gold I thought it appropriate to take a week off from Lindsay’s long-cycle discussion to examine the timing of possible lows in gold.
Gold bugs take heart–April showers bring May flowers!
Cycles are rarely exact but when we see a convergence of cycles on the same time period we are forced to take notice. Mid-May looks like a time ripe with the possibility for a low to the 2011 bear market in gold.
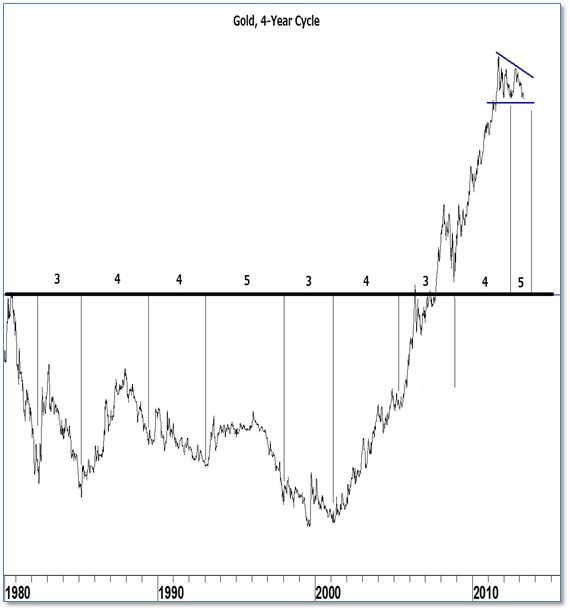
Four Year Cycle
A four-year cycle is apparent in gold. It can be as short as three years and as long as five years. When one cycle is short, the next cycle seems to “catch-up” on lost time by being long and vice versa.
The lows of 2005 and 2008 made for a short duration cycle and led me to believe our current cycle would be long (closer to five years than to four). Even if new lows were not made in the fifth year of the current cycle the longer cycle should hold down any attempts for gold to advance until closer to this time period.
21 Month Cycle
The 21-month cycle is due for an inflection point during the month of May. Notice how well this cycle has marked turning points since 2006. Granted, they have all been tops and we’re looking for a bottom this time, but an inflection point is what the cycle times. Gold would have to experience quite a rally between now and May for me to believe another top is coming.
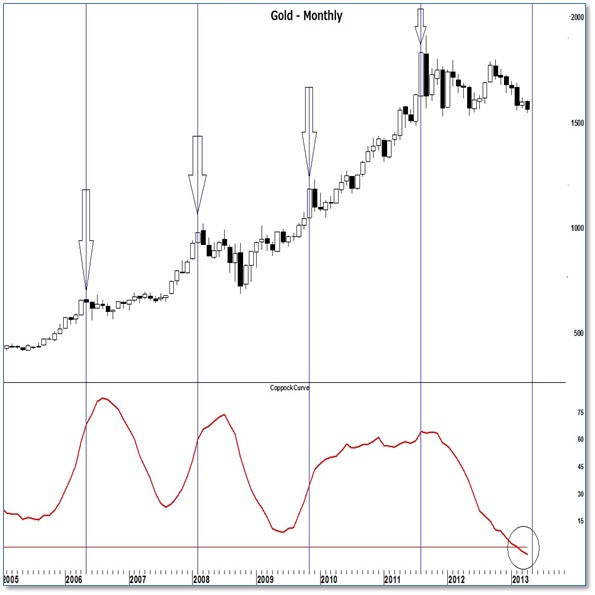
The monthly Coppock Curve is shown in the bottom pane. Throughout the entire 2011 correction it has never become oversold until now. This is another reason to think that a sustainable low is now possible.
Middle Section Counts
There are several weekly cycles as well which point to a low in mid-May of this year. With so many cycles pointing to the third week of May, I thought it might be interesting to see if our Lindsay models could confirm a date anywhere near this time frame. I caution readers that Lindsay never used his models on any asset-class other than equities. He did write that his Counts from the Middle Section applied to several different “time series”. Presumably that means asset classes.
A descending middle section in 2003 counts 1,847 days from point E on 2/25/03 to the high of the basic cycle (black lines) on 3/17/08. The 4/4/13 low is 1,844 days later.
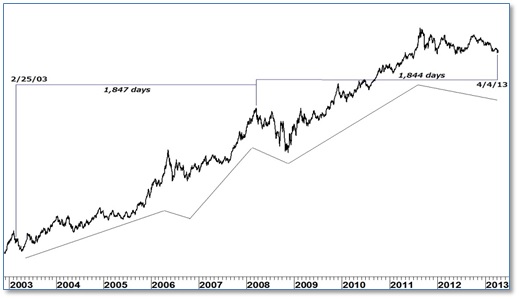
Until Friday, that low had been the low of the 2011 bear market in gold. But Lindsay wrote that the low of a long cycle (and that is what the 2011 decline is starting to look like) should be counted from a turning point at the top of the final basic cycle of the long cycle. At this point the old question of which date is the correct turning point raises its head; should the closing high on 8/23/11 be used or the intra-day high on 9/6/11?
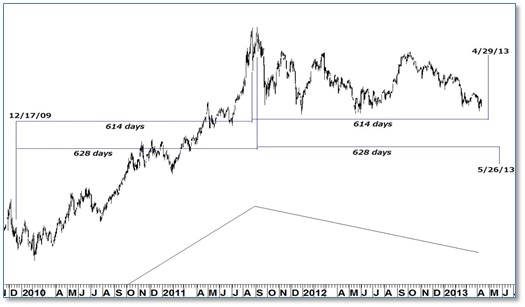
A descending middle section in December 2009 counts 628 days from point C on 12/17/09 to 9/6/11. Point C counts 614 days to 8/23/11. These counts forecast a low to the 2011 decline on the dates 5/26/13 and 4/29/13.
Bottom Line
It doesn’t look like Friday’s sell-off will be the low everyone is looking for. It doesn’t look as if it could be profitable to even start looking for that low until early May.
= = =
For more analysis like the above, take a ‘Sneak-Peek’ at Seattle Technical Advisors.com

