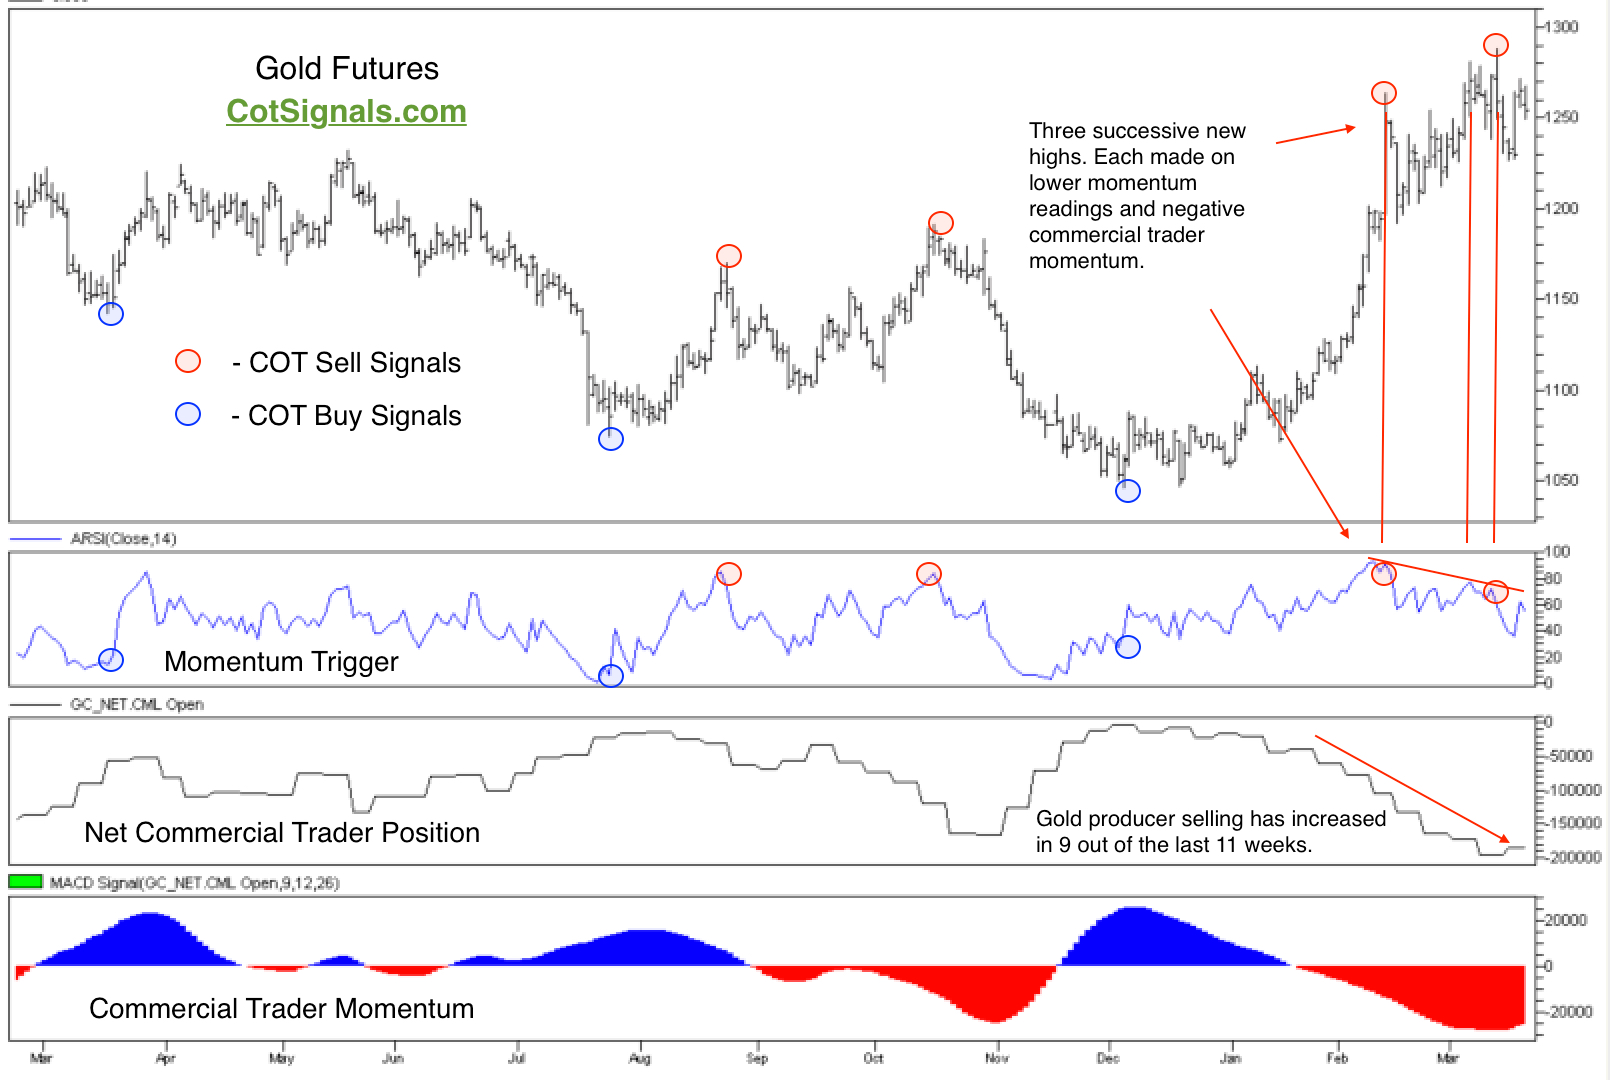
Gold has rallied more than $200 per ounce since mid-December. Beginning this year, commercial gold producers have taken the lead in the commercial trading category as the total net commercial trader position has become increasingly short in 9 out of the last 11 weeks. The market has been consolidating near its highs while building an increasingly bearish divergence pattern. We believe that the technical pattern along with the fundamental selling by gold producers will conspire to push gold prices lower as the world settles down and continues to deflate.
There are just a couple of points to make this week as I believe this chart really is worth a thousand words. First of all, the increasing bearishness of the net commercial trader position is made up of two factors. Miners who need to hedge forward production and raise operating cash are the primary players but, there are also long hedgers who will lift their hedges if the market moves sufficiently for them to realize a profit in the futures without having to disturb their physical positions. The $200 per ounce rally has been more than enough to bring both of these players to the market.
Secondly, the market is reaching major resistance levels. Part of the reason we’re seeing such a tremendous and concerted selling effort by the commercial traders is because this is the first chance since last January to sell gold at these prices. Last January when gold last traded above $1,300 per ounce, we saw the net commercial trader position increase to short 206k+ contracts. The current high for this move is $1,287 and the corresponding net commercial position is short 195k contracts. $1,300 per ounce represents significant value for gold miners trying to get their product sold in a deflationary global economy.
Finally, we want to examine last week’s technical action in conjunction with the dovish FOMC and ECB actions. The world is playing tug of war between global inflation and deflation. European, Japanese and Chinese weakness appear to offset any strength the Fed sees domestically. Meanwhile, there are plenty of domestic pundits that thought the Fed was off its rocker with the first hike. Their battle is pushing money into gold as a known asset, for better or worse. Technically, the battle that’s raging looks like the bears are about to get the best of the longs. Each of the recent highs was made on lower short-term market momentum readings creating a giant bearish divergence. Furthermore, the bearish divergence is accompanied by continuing commercial selling pressure. Lastly, the relatively unchanged open interest in the gold market over the last two weeks means that the commercial traders are increasing their market share. Commercial traders now find themselves holding just over half of the total open interest.
We believe the chart below suggests we’ll see $1,150 long before we see $1,350.
See COT Signals for more information on our nightly mechanical and discretionary advisory services.


