The Golden Sunrise
The essential morning read for investors!
Golden Sunrise is the Golden Surveyor’s broad-based market and world view.
Written daily 4am-7am by markets information specialist GS John!

Today’s Golden Sunrise
Monday, May 17. 2010
Hours of daily research consolidated for you
Good looking from far but far from good looking.
Last week’s data sheet-very good looking
|
Market |
7-May |
14-May |
ChangeWK |
%changeWK |
ChYTD |
%ChYTD |
|
Japan-Tpx |
931.74 |
936.45 |
4.71 |
0.506% |
28.86 |
3.180% |
|
HongKong |
19,920.59 |
20,145.43 |
224.84 |
1.129% |
-1271.57 |
-5.937% |
|
Shanghai |
2688.38 |
2696.63 |
8.25 |
0.307% |
-566.37 |
-17.357% |
|
Taiwan |
7567.18 |
7772.13 |
204.95 |
2.708% |
-339.87 |
-4.190% |
|
South Korea |
1647.5 |
1695.63 |
48.13 |
2.921% |
62.63 |
3.835% |
|
Australia |
4480.75 |
4611.1 |
130.35 |
2.909% |
-221.9 |
-4.591% |
|
Singapore |
2,825.16 |
2,855.21 |
30.05 |
1.064% |
-24.79 |
-0.861% |
|
India |
16,751.99 |
16,943.34 |
191.35 |
1.142% |
-400.66 |
-2.310% |
|
|
|
|
|
|
|
|
|
UK-FTSE |
5123.02 |
5262.85 |
139.83 |
2.729% |
-175.15 |
-3.221% |
|
Germany |
5715.09 |
6056.71 |
341.62 |
5.978% |
44.71 |
0.744% |
|
France |
3392.59 |
3560.36 |
167.77 |
4.945% |
-399.64 |
-10.092% |
|
|
|
|
|
|
|
|
|
|
|
|
|
|
|
|
|
DJIA |
10,380.43 |
10,620.16 |
239.73 |
2.309% |
192.11 |
1.842% |
|
S&P500 |
1110.88 |
1135.68 |
24.8 |
2.232% |
2.69 |
0.237% |
|
NasComp |
2265.64 |
2346.85 |
81.21 |
3.584% |
38.85 |
1.683% |
|
NDX100 |
1849.44 |
1907.1 |
57.66 |
3.118% |
20.1 |
1.065% |
|
R2000 |
653 |
693.98 |
40.98 |
6.276% |
53.88 |
8.417% |
|
NYSE |
6916.14 |
7077.64 |
161.5 |
2.335% |
-249.36 |
-3.403% |
|
Tran |
4298.12 |
4487.73 |
189.61 |
4.411% |
356.73 |
8.635% |
|
Util |
370.85 |
379.82 |
8.97 |
2.419% |
-19.18 |
-4.807% |
|
|
|
|
|
|
|
|
|
Canada-TSX |
11,692.43 |
12,014.97 |
322.54 |
2.759% |
312.97 |
2.675% |
|
TSX Venture |
1549.35 |
1593.11 |
43.76 |
2.824% |
39.11 |
2.517% |
|
Brazil |
62,890.08 |
63,412.47 |
522.39 |
0.831% |
116.47 |
0.184% |
|
|
|
|
|
|
|
|
|
Gold |
1210.4 |
1227.8 |
17.4 |
1.438% |
130.8 |
11.923% |
|
Silver |
1842.9 |
1920.2 |
77.3 |
4.194% |
225.2 |
13.286% |
|
Copper |
313.1 |
312.3 |
-0.8 |
-0.256% |
-20.7 |
-6.216% |
|
Crude Oil |
75.11 |
71.61 |
-3.5 |
-4.660% |
-4.39 |
-5.776% |
|
Natural Gas |
4.015 |
4.312 |
0.297 |
7.397% |
-1.438 |
-25.009% |
|
CRB Index |
261.02 |
258.55 |
-2.47 |
-0.946% |
-26.45 |
-9.281% |
|
|
|
|
|
|
|
|
|
$index |
84.65 |
86.23 |
1.58 |
1.867% |
8.28 |
10.622% |
|
Euro |
1.2724 |
1.2387 |
-0.0337 |
-2.649% |
-0.1904 |
-13.323% |
|
Yen |
1.0941 |
1.0848 |
-0.0093 |
-0.850% |
0.013 |
1.213% |
|
|
|
|
|
|
|
|
|
VIX |
40.95 |
31.24 |
-9.71 |
-23.712% |
9.56 |
44.096% |
|
VXN (Nas) |
41.52 |
31.55 |
-9.97 |
-24.013% |
9.9 |
45.727% |
|
VXV (S&P) |
36.62 |
30.8 |
-5.82 |
-15.893% |
6.91 |
28.924% |
|
RVX(R2000) |
45.83 |
39.29 |
-6.54 |
-14.270% |
11.14 |
39.574% |
The year to date figures are not so pretty..the vix escalations not cute.
The IWM which has been a market stalwart on the surge from February 5th lows off the January highs.
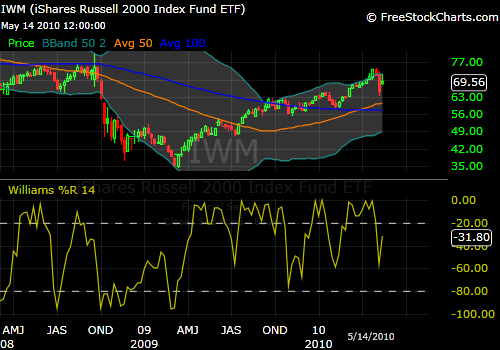
Last week was up…but look at the two weeks prior..ugly..and look at the wick on the candle above the open-close body of the candle which tells you sellers came in and drove the price down.
The IWM on a daily-the last two days gave back most of the previous 3 days’ rally following the historic Th/Fr plummet the week before.
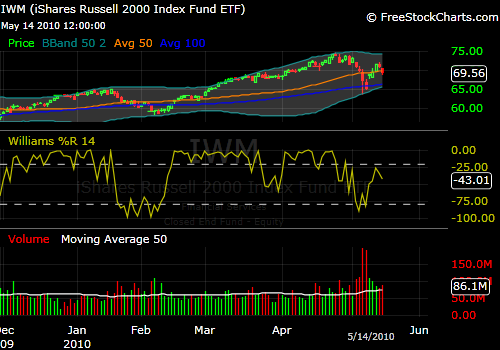
Like so many of the key indexes and leading stocks, the IWM has broken back under the 50DMA. Many stocks had their 200s hit on the Thursday debacle, the 100DMAs for sure, and those may well be the support levels for a bounce.
Everyone has an opinion and all are backed by some rationale but the fundamental law of sales and marketing is that people make decisions emotionally and back them up with logic. The big question is how everyone is feeling about the financial future going into this week’s trading which ends Friday with options expiration to add a little combustible material to the environment.
So many people think we need to figure what happened on the 1000 point drop in 10 minutes on Thursday..fat-fingers, 16,000 S&P contracts sold, algo trading, sell-stops hit, etc etc etc..nobody can figure this out..not the SEC, not GS, not JPM..so let’s investigate and we’ll let you use your Junior Woodchuck Market Sleuth training course as a basis.
- Besides being cute, you are very, very smart.
- You are a math, computer, physics PHD.
- Your job is to design automatic trading systems that make money for your company…lots of it, without a lot of ethical encumbrances.
- You’re a sports fan and study the very best to get an edge
- You know Peyton Manning is a very good quarterback and he knows the rules of football.
- You know that Tiger Woods understands the rules of golf even though he may be challenged in other areas of life
- You can think of dozens, hundreds, thousands of success stories and every one of them had the common denominator of knowing the rules, how things work.
- You decide that for your computer trading to work you must understand how the rules work
- One area would be to understand what happens under various market conditions..like where would halts and pauses come in and under what conditions and for how long.
- You discover that that the bigger markets pause but the smaller ones don’t and your programs will reroute orders to those places still trading..or other trader’s programs will..
- You, being smart enough, to figure out all the intricacies of setting up a trading system to begin with, can figure out the trigger points and how to profit big-time.
- As a result of having made a mountain of money in 10 minutes, you are now even cuter and you sing well too.
To solve this and find out how it happen, skip all the letters from the people who had stops in on Apple at 200 when it was trading at 250 (why would you do that? If you were willing to sell at 200 you shouldn’t complain, you are just mad because it bounced which made a fool out you-which was already accomplished by the sell-stop point).
Find the people who made the money and ask them. They know.
Asia got smashed last night—the SSEC (Shanghai) was down 5.07% to 2559.93 after a period of decline. Selling climax or more to come?
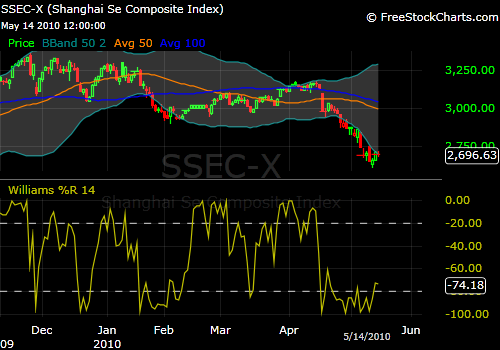
Last night’s decline is NOT reflected on this chart. We’ll soon know how China markets influence western bourses.
Australia was hammered ..BHP down 4.59%, other miners as well.. except for Lihir Gold and Newcrest Mining ( a gold producer which is buying Lihir) were both up a tiny fraction.
Europe and US futures started out red and green this morning.. the DAX, FTSE and CAC significantly so.
It is Monday and the track record for Mondays’ has been extraordinary.
Physical metal demand is skyrocketing-especially for gold and especially out of Germany. Kruggerand demand has seen major dealers moving orders to South Africa from 2000 to 15,000 and 30,000 as cited by the Financial Times.
Having gone through hyperinflation in the twenties and the catastrophe of World War II which destroyed the currency again, the Germans might have a wee bit of understanding that gold preserved wealth before, during and after these events.
You can trust gold or trust Trichet, Geithner, Bernanke, Obama, Frank, Reid or Pelosi. You can trust gold or the politician’s hopes and dreams for your wealth.
Whatever you decide.
JohnR
Goldensurveyor.com