
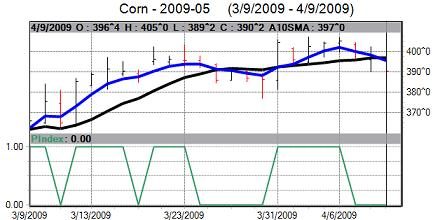
May corn on Thursday closed lower, near the session low, closed at a bearish weekly low close and scored a bearish “outside day” down on the daily bar chart. Corn sold off Thursday despite a friendly USDA supply and demand report issued Thursday morning and despite mostly bullish “outside markets”–a stronger U.S. stock market and higher crude oil prices. The fact that corn sold off today in the face of bullish factors is a bearish omen for the corn market. The bulls’ next upside price objective is to push and close prices above solid technical resistance at the April high of $4.07 1/2. The next downside price objective for the bears is to push and close prices below solid technical support at $3.76 3/4 a bushel. First resistance for May corn is seen at $3.95 and then at $4.00. First support is seen at Thursday’s low of $3.89 1/4 and then at $3.85.
$8.22 ——– the contract high
$3.97 ——- 10-day moving average
$3.94 1/2 — 20-day moving average
$3.79 1/2 — 40-day moving average
$3.15 3/4 — the contract low
Source: VantagePoint Intermarket Analysis Software
Call now and you will be provided with FREE recent forecasts
that are up to 80% accurate. 800-732-5407
If you would rather have the recent forecasts sent to you, please go here.
May wheat on Thursday closed lower, near the session low and closed at a bearish weekly low close. Bears last week gained fresh downside near-term technical momentum. The key outside markets were mostly bullish for wheat Thursday, as the U.S. stock market was higher and crude oil prices were higher. Yet, the wheat market sold off, which is a bearish clue. Thursday morning’s monthly USDA supply and demand report was deemed neutral for the market. Wheat bears have the overall near-term technical advantage. The next downside price objective for the bears is pushing and closing prices below solid technical support at the March low of $4.98 1/2. Bulls’ next upside price objective is to push and close May futures prices above solid technical resistance at this week’s high of $5.72 3/4 a bushel. First resistance is seen at Thursday’s high of $5.43 1/2 and then at $5.50. First support lies at Thursday’s low of $5.21 and then at $5.15.
$11.90 ——- the contract high
$5.34 1/4 — 10-day moving average
$5.35 ——– 20-day moving average
$5.30 1/4 — 40-day moving average
$4.84 1/4 — the contract low
May KCBT wheat on Thursday closed lower, near the session low and closed at a bearish weekly low close. Bears still have the overall near-term technical advantage and have recently gained more downside momentum. The bulls’ next upside price objective is pushing prices above solid technical resistance at $6.00. The bears’ next downside objective is pushing and closing prices below solid technical support at $5.50. First resistance is seen at $5.80 and then at Thursday’s high of $5.91. First support is seen at $5.70 and then at $5.60.
$12.55 ——– the contract high
$5.78 3/4 — 10-day moving average
$5.82 3/4 — 20-day moving average
$5.74 1/2 — 40-day moving average
$5.13 ——– the contract low
May soybeans on Thursday closed slightly higher and near the session low after hitting a fresh 10-week high early on. The low-range close does suggest the bulls are getting tired after the recent rally. However, Thursday’s price action did produce a bullish weekly high close. But the fact that prices only rallied a couple cents following a friendly USDA supply and demand report Thursday morning and amid mostly bullish outside markets also is a worry for the bulls. Bean bulls have the near-term technical advantage. Prices are in a six-week-old uptrend on the daily bar chart. The next upside price objective for the bean bulls is to push and close prices above solid technical resistance at the January high of $10.69 a bushel. The next downside price objective for the bears is pushing and closing prices below solid technical support at $9.80 a bushel. First resistance for May soybeans is seen at the February high of $10.24 and then at $10.50. First support is seen at $10.00 and then at $9.90.
$16.44 1/2 — the contract high
$9.69 1/2 — 10-day moving average
$9.51 ——- 20-day moving average
$9.16 ——- 40-day moving average
$7.86 1/2 —- the contract low
May soybean meal on Thursday closed weaker and near the session low after hitting a fresh 2.5-month high early on. While bulls do still have the near-term technical advantage, they appeared to become exhausted at higher price levels Thursday. The next upside price objective for the bulls is to produce a close above solid technical resistance at Thursday’s high of $319.00. The next downside price objective for the bears is pushing and closing prices below solid technical support at $295.00. First resistance comes in at $313.30 and then at the February high of $316.60. First support is seen at $308.80 and then at $305.00.
$433.60 — contract high
$299.40 — 10-day moving average
$295.90 — 20-day moving average
$284.10 — 40-day moving average
$237.00 — the contract low
May soybean oil on Thursday closed higher and near mid-range but did hit a fresh three-month high and closed at a bullish weekly high close. Bean oil bulls have the near-term technical advantage and gained more upside momentum Thursday. Prices are in a four-week-old uptrend on the daily bar chart. The next upside price objective for the bean oil bulls is pushing and closing prices above solid technical resistance at the January high of 37.81 cents. Bean oil bears’ next downside technical price objective is pushing and closing prices below solid technical support at 33.00 cents. First resistance is seen at today’s high of 35.96 cents and then at 36.50 cents. First support is seen at today’s low of 34.93 cents and then at this week’s low of 34.43 cents.
70.23 — the contract high
34.22 — 10-day moving average
33.15 — 20-day moving average
32.13 — 40-day moving average
28.89 — the contract low

