

Last week the small caps finally joined in on the SPX (S&P 500 index) rally and outperformed all the indexes by leaps and bounds. It was something I expected and we were long IWM (iShares Russell 2000 Index ETF) with the expectations that it would play catch up.
IWM took its time joining in on the rally and overall, is still underperforming the other major indexes.
Why do I expect some type of pull back?
Because sentiment has reached an extreme greed level, the VIX (Volatility S&P 500) is about to trigger another equity sell signal and there are five waves up on IWM.
Price Levels To Watch
For those reasons, I am expecting IWM to at the least retrace some of the big move it has made over the last three days. Looking at some possible targets for where IWM could turn lower, would be 117.30, which is the resistance level from the January 22 high. If IWM decides to head above that resistance level, then the next spot to watch would be the 78% Fibonacci resistance level. Now if IWM does turn at any of the levels mentioned above, it will also have a potential bearish head/shoulder pattern forming.
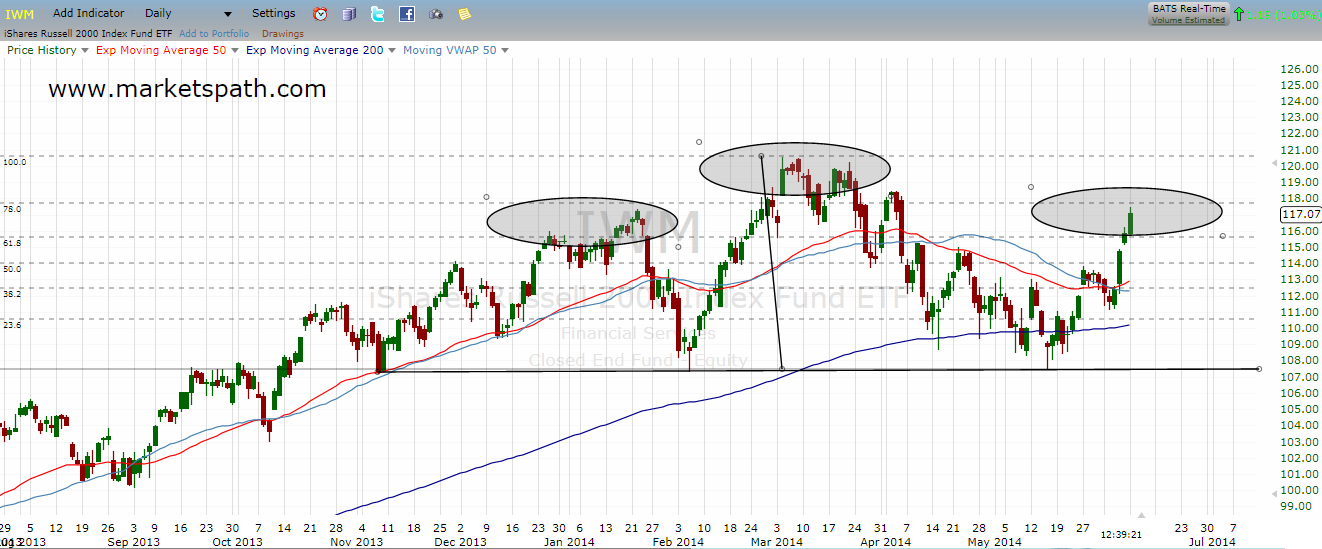
The bearish head/shoulders pattern if played out, would have a $94 target on IWM. I have no idea if it will play out or not and we took a short position at 117.15 for a quick trade. The first target I expected for this pull back is the 114 area. If the bearish pattern plays out, I will simply take another short position.
But for now, focusing on the shorter term targets and adjusting downside targets if necessary, has been the safest way to trade this market.
= = =
There is another long term pattern that is play for the Russell 2000. You can see it here for free.

