

Sometimes following news stories and economic events can be very confusing. For me, the way to cut through all the “noise” is I have a handful of metrics that help me understand the largest macro forces at play in the world and the markets. These metrics provide a perspective that acts like a North Star and is very beneficial in financial decision making.
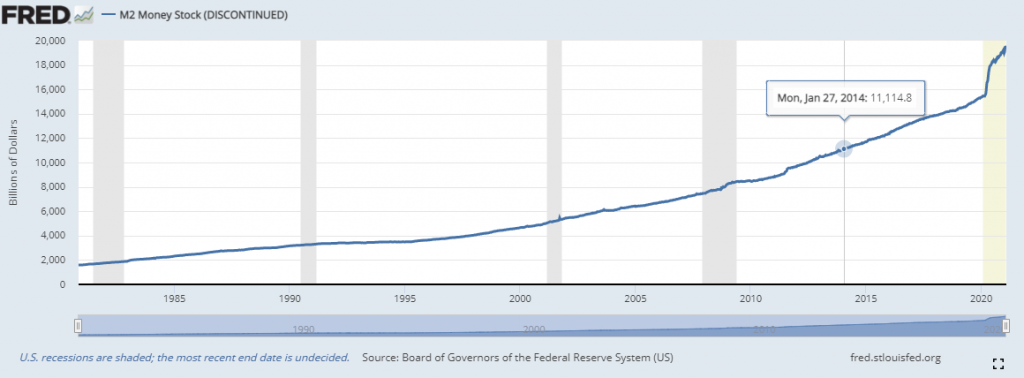
In the past, the most important metric was the Federal Reserve Money Supply statistics. This chart used to let us know how much new money was being injected into the economy and how. This metric has been discontinued by the Fed, so we are left to imagine whether our purchasing power is being diluted by more dollars being added to the economy, or not. This is what the Money supply looked like over the last 40 years.
Throughout any economic environment you always have to ask yourself what is the risk-free rate of return as well as the real rate of return. Traditionally the risk-free rate of return has been found in simply looking at a 90-day Treasury Bill yield. This interest rate is what millions of investors and savers around the world look at every day as they decide whether to “save” or “invest” their funds.
Here is a long-term chart of the United States Treasury Bill Yield going back to 1982. Currently, the yield is .0532%.
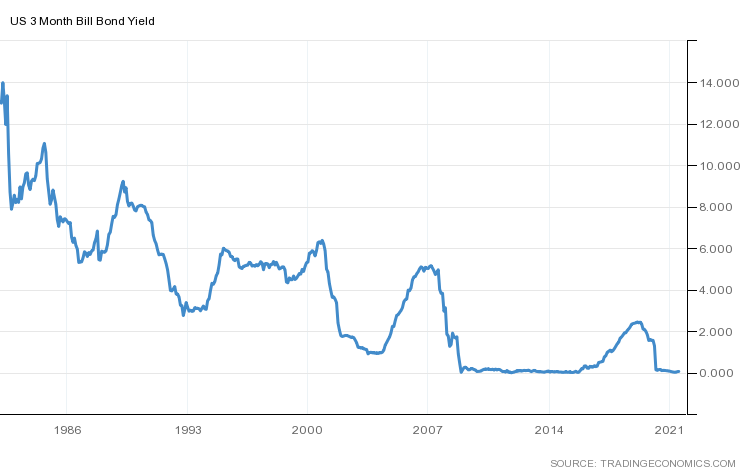
This treasury yield is the main determinant of behavior in an economy because it provides the first glimpse of how to define “risk” as well as how to protect purchasing power. Often, in the media, you will read articles where economists will change the length of the U.S. Treasury Instrument to 10 years in duration. Essentially, they are trying to measure “risk” and the ability to “save.”
Once we understand this yield, we only have half of the equation. We then have to look at what the expected inflation rate is and subtract that value from the risk-free return. Every month the government releases economic numbers of the Consumer Price Index as well as the Producer Price Index. When we subtract the value from the Consumer Price Index from the Risk-Free Rate of Return, we then arrive at what is called the REAL Rate of Return. This is what your expected return would be after INFLATION.
Here is what it looks like in a chart format.
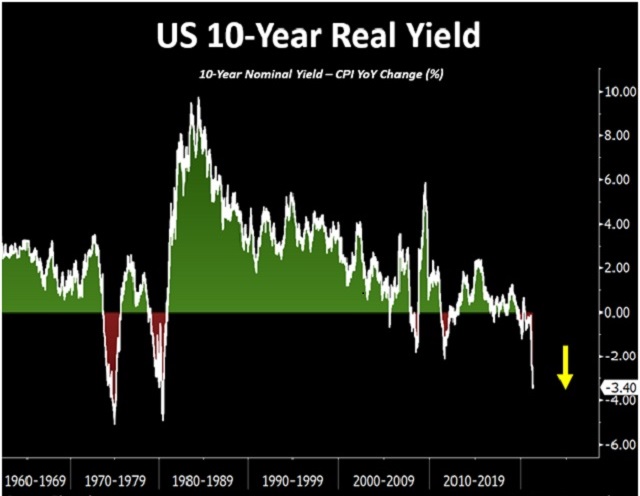
The immediate problem you will observe is economists love to make mountains out of minutia. There is great debate about how the Consumer Price Index value is calculated. However, the only important thing that you as a saver, trader or investor need to calculate is what is the approximate real rate of return right now?
If you study the chart above and try to comprehend it, you will be able to recognize the ills that are plaguing much of the financial marketplace.
Currently the Real Rate of Return is -3.52% which essentially means that saving is impossible. What the government is telling us through this calculation is that you are guaranteed to lose money if you stay in cash, or cash substitutes.
But this also tells us much, much more. If it’s impossible to save money in a risk-free manner it makes us question the very fabric of the social contract between the government and the individual. Simply consider whether you would invest your funds into a guaranteed loser? Then ask yourself who in these instances will buy government debt? The only answer you can arrive at is that the Federal Reserve, the country’s Central Bank, ends up purchasing government debt in these instances. Also, many Federal, State, and Local pension programs are required by statutory law to purchase these guaranteed losses. These pension programs often require yields of 7% to remain viable to be able to disburse their pension obligations. So, you can see, the danger and risk that a -3.52% real rate of return creates for all the pension programs of local, state and federal governments.
As you ponder the Real Rate of Return being negative also think about how that contributes to unnecessary speculative activity in an economy. People who simply do not want to lose purchasing power are now chasing yield in volatile speculative alternatives. Everybody in an economy is concerned about protecting their purchasing power.
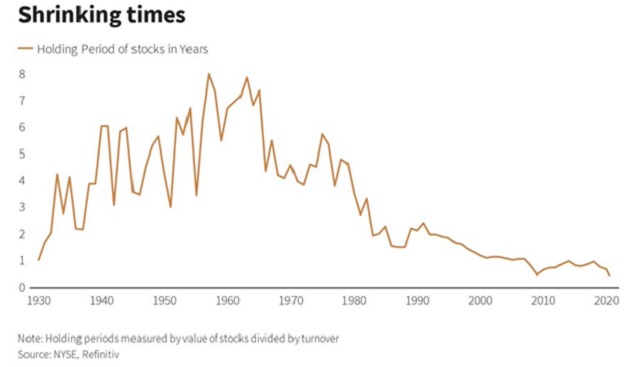
This is also reflected in a reduced amount of time that investors and traders hold their stocks. The following graphic depicts how in the past, the average time investors held on to their stocks. Today, almost everyone is looking at holding times of less than one year.
Since risk appears to be ever present, the mindset is “I demand returns now!”
Or have you wondered over the past year why Real Estate prices have been exploding higher? People and money managers who simply want to protect the purchasing power of their funds chase yield by all pouring into investments that initially appear to offer protection of purchasing power and store of value. Here is a chart of the Case-Shiller Composite Home Index which shows a 14.87% increase over the last 17 months.
Why would real estate prices go up 14% year over year? Money managers who manage hundreds of billions of dollars start moving their funds out of treasuries and into something they perceive to be secure like real estate.
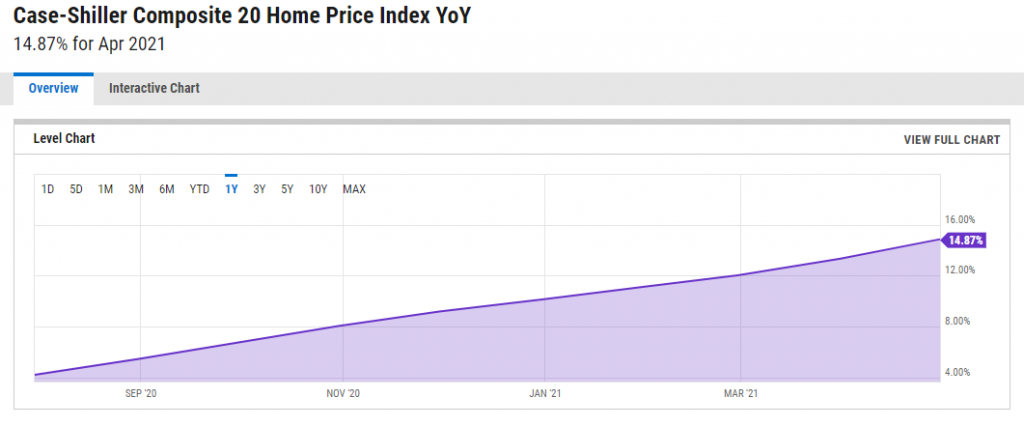
Consider how the phenomena of an inability to save money stops prospective homeowners from being able to purchase a home. When the real rate of return is -3.52% and home values are rising by 14.87% a year, the saver can’t save fast enough to compensate for the price of a home rising in price. Thus, they’re forced to speculate because as famed money manager, Ray Dalio states, “cash is trash.”
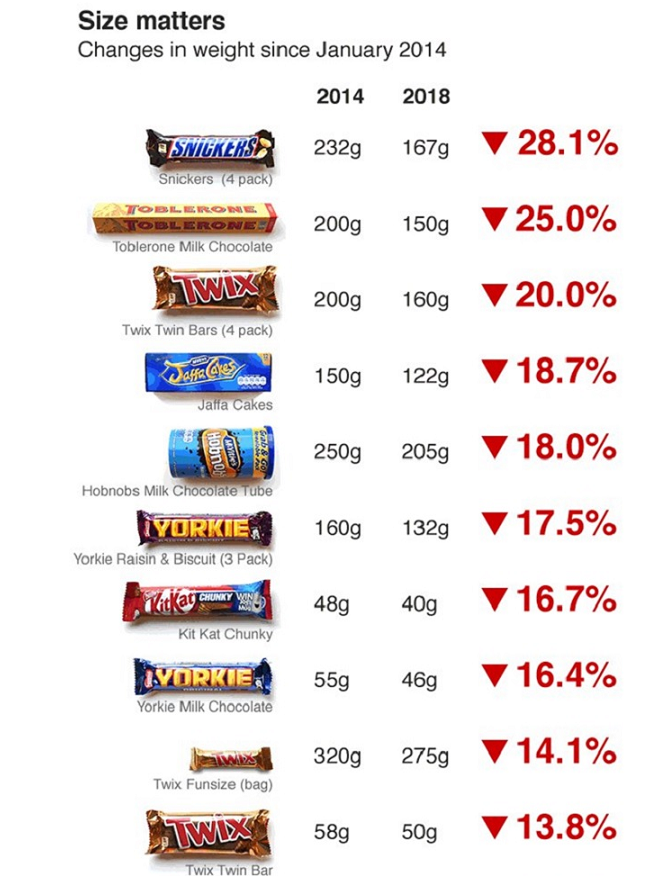
This is how wealth inequality is created and compounded in a society. The rich get richer, and the poor get poorer. At its most basic level what we are talking about is the how and why you have less bang for your buck. This is called “SHRINKFLATION.” The malignant manner in which it shows up for businesses is that businesses simply provide less of whatever it is you are buying for the same price. Companies do not want to spook customers with price spikes, so they simply provide less of a product. Sometimes the packaging is very cleverly disguised. There may be fewer potato chips in the same sized “family bag” compared, or fewer sheets of toilet paper per roll. Think of the way you dilute your shampoo at home with water to make it last longer. The problem is that this is often disguised with deceptive packaging, so the customer is oblivious to the invisible price increase. The term “shrinkflation” was initially coined by economist Pippa Malmgren to illustrate these sneaky price increases. As you visit your grocery store you may have noticed many instances of shrinkflation occurring. What compounds the frustration in society is that businesses are often blamed for raising their prices when in fact they are simply responding to a currency debasement on the part of the government.
Here is a graphic of what has occurred to popular name-brand candy bars over the past few years. Notice how the weight of the offering has been reduced substantially to disguise the “shrinkflation.”
Here are more than twenty examples of shrinkflation product sizes to prove my point. Items in bold are changes that occurred after January 2020. You’ll see how these invisible price increases often amount to as much as 50% shrinkage over a very short period of time.
| Breyer’s ice cream (Was: 64 oz.; Then: 56 oz.; Now: 48 oz.) |
| Charmin Ultra Strong toilet paper (Was 286 sheets; Now: 264 sheets) |
| Coffee (Was: 16 oz.; Then: 15 oz.; Then: 13 oz.; Now: 10 oz.) |
| Country Crock margarine (Was: 48 oz.; Now: 45 oz.) |
| Dawn dish soap, small (Was: 8 oz.; Now: 7 oz.) |
| Haagen Dazs ice cream (Was: 16 oz.; Now: 14 oz.) |
| Hershey’s kisses, family size (Was: 18 oz.; Now: 16 oz.) |
| Hillshire Farms Polska Kielbasa (Was: 16 oz.; Then: 15 oz.; Now: 14 oz.) |
| Ivory dish soap (Was: 30 oz.; Now: 24 oz.) |
| Keebler Club Crackers (Was: 13.7 oz.; Now: 12.5 oz.) |
| Kirkland Signature paper towels (Was: 96.2 sq. ft.; Now: 85 sq. ft.) |
| Lay’s Potato Chips, party bag (Was: 15.25 oz.; Now: 13 oz.) |
| Mayonnaise (Was: 32 oz.; Now: 30 oz.) |
| Nathan’s Hot Dogs, skinless: (Was: 16 count; Now: 14 count) |
| Nutella (Was: 14.1 oz.; Now: 12.3 oz.) |
| Powerade (Was: 32 oz.; Now: 28 oz.) |
| Puffs tissue (Was: 56 count; Now: 48 count) |
| Ragu spaghetti sauce (Was: 28 oz.; Now: 24 oz.) |
| Scott toilet paper (Was: 115.2 sq. ft.; Now: 104.8 sq. ft.) |
| StarKist tuna (Was: 6 oz.; Now: 5 oz.) |
| Yogurt (Was: 8 oz.; Now: 6 oz.) |
Any way you look at it, it means you as a consumer are getting a lot less bang with your dollar.
Sometimes though “shrinkflation” cannot be hidden.
One of the most fascinating price distortions which has occurred in the past year, due to the Feds money printing accompanied by the economic lockdown is that the price of used cars has exploded. Since Wall Street money managers are considered all-stars when they achieve 20%+ year over year compounded annual returns, I find it absolutely fascinating that used car prices have increased over 30% over the same time last year.
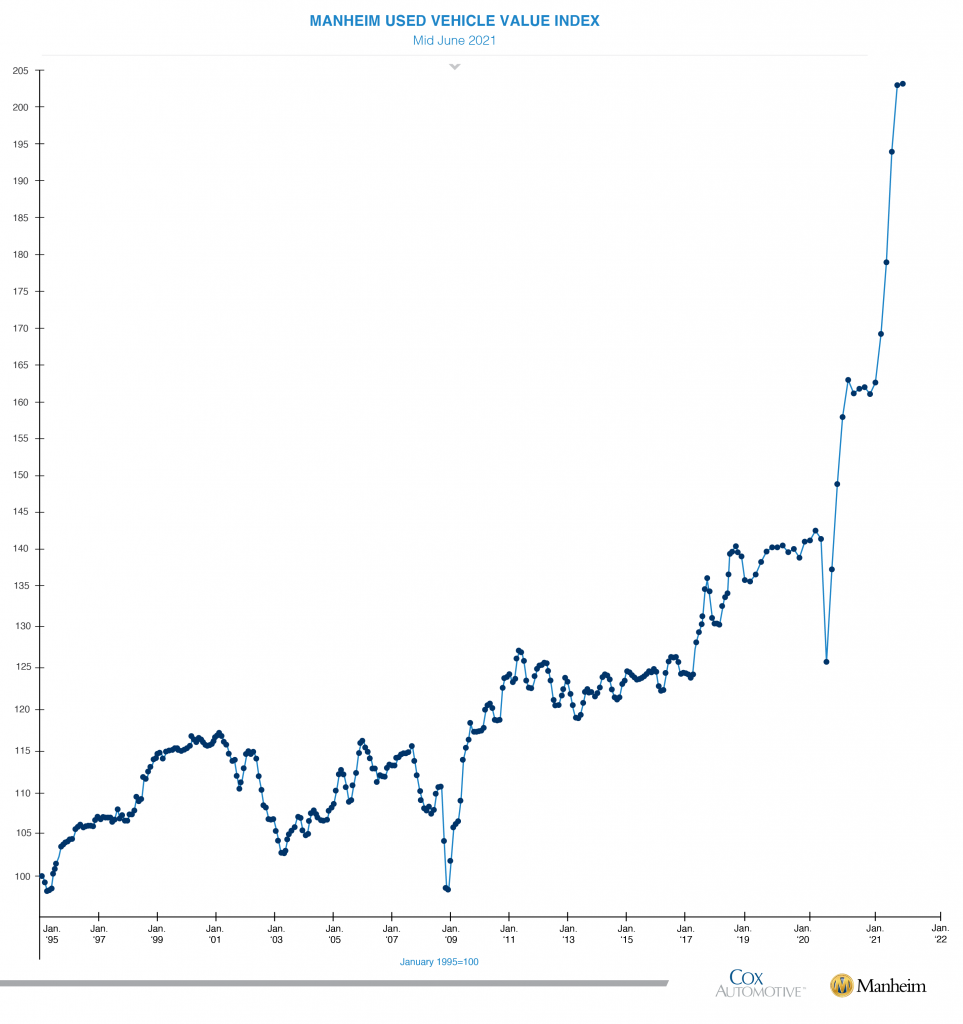
Historically, the used car has been viewed as a depreciating asset, since used cars traditionally lose 5% to 10% of their value every year. It boggles the mind how a depreciating asset like an automobile turned out to be one of the best investments of the past year.
I’ll be the first to admit that making sense of these metrics can be intimidating. It has become impossible to save and everyone is forced to chase yield in a negative real rate of return world.
My thesis is we live in a world of currency debasement where the largest beneficiaries will be blue chip stocks, precious metals, and bitcoin. So far that thesis from a fundamental perspective has worked very well over the past 16 months.
Stocks are up 36% over the past year.
Gold is down 3.37%
Bitcoin, despite its massive drawdown over the past three months is still up 268% year over year.
The only way that I know how to make sense of the madness that is our current economic environment is through the power of artificial intelligence, neural networks, and machine learning. In trading, the only thing that matters is price. It is what creates wealth or devastates your trading account.
My reality is always formed by what I see, hear, feel, and understand. This is why I use artificial intelligence, neural networks, and machine learning to guide my trading decisions.
Trying to protect your purchasing power has to become your primary mission as you navigate the financial world.
Everybody has had horrible trades. The difference between the winners and losers in life is that the winners learned very powerful lessons from their losses.
Artificial intelligence is so powerful because it learns what doesn’t work, remembers it, and then focuses on other paths to find a solution. This is the Feedback Loop that is responsible for building the fortunes of every successful trader I know.
It’s not hard to appreciate that A.I. applies mistake-prevention to discover what is true and workable. Artificial Intelligence applies this as a continual process 24 hours a day, 365 days a year towards whatever problem it is looking to solve.
That should get you pretty excited because it is a game-changer.
To make money you must move past opinions… and focus on FACTS. However, most traders love DRAMA and there is no shortage of that when it comes to making money. Braggards are everywhere trying to proclaim their dominance and insider knowledge.
There is only one fact in the world of markets and that is PRICE. What the price of an asset does is the only thing that matters to a trader.
Price is the only thing that can create wealth. As experienced traders have learned, the market is never wrong, but opinions often are!
This is painfully obvious in hindsight, but traders often get trapped in the story and it forces them to behave quite irrationally.
“Stories” capture the imagination and make us all think about possibilities. BUT stories are where RISK lives.
Traders must concern themselves only with how the price of an asset responds to NEWS and STORIES. This is exactly why artificial intelligence is invaluable in helping traders focus on solid trends.
There is only one fact in the world of markets and that is PRICE.
Stories pull on our heart strings and can make traders make decisions irrationally. Trading success comes from making decisions based only on cold, hard FACTS!
We live in very exciting times.
What hurts others can instruct us.
A.I. is the framework where risk and opportunity are very clearly defined.
Remember, artificial intelligence has decimated humans at Poker, Jeopardy, Go! and Chess. Why should trading be any different?
Visit with us and check out the A.I. at our Next Live Training.
Discover why Vantagepoint’s artificial intelligence is the solution professional traders go-to for less risk, more rewards, and guaranteed peace of mind.
It’s not magic. It’s machine learning.
Make it count.

IMPORTANT NOTICE!
THERE IS SUBSTANTIAL RISK OF LOSS ASSOCIATED WITH TRADING. ONLY RISK CAPITAL SHOULD BE USED TO TRADE. TRADING STOCKS, FUTURES, OPTIONS, FOREX, AND ETFs IS NOT SUITABLE FOR EVERYONE.
DISCLAIMER: STOCKS, FUTURES, OPTIONS, ETFs AND CURRENCY TRADING ALL HAVE LARGE POTENTIAL REWARDS, BUT THEY ALSO HAVE LARGE POTENTIAL RISK. YOU MUST BE AWARE OF THE RISKS AND BE WILLING TO ACCEPT THEM IN ORDER TO INVEST IN THESE MARKETS. DON’T TRADE WITH MONEY YOU CAN’T AFFORD TO LOSE. THIS ARTICLE AND WEBSITE IS NEITHER A SOLICITATION NOR AN OFFER TO BUY/SELL FUTURES, OPTIONS, STOCKS, OR CURRENCIES. NO REPRESENTATION IS BEING MADE THAT ANY ACCOUNT WILL OR IS LIKELY TO ACHIEVE PROFITS OR LOSSES SIMILAR TO THOSE DISCUSSED ON THIS ARTICLE OR WEBSITE. THE PAST PERFORMANCE OF ANY TRADING SYSTEM OR METHODOLOGY IS NOT NECESSARILY INDICATIVE OF FUTURE RESULTS. CFTC RULE 4.41 – HYPOTHETICAL OR SIMULATED PERFORMANCE RESULTS HAVE CERTAIN LIMITATIONS. UNLIKE AN ACTUAL PERFORMANCE RECORD, SIMULATED RESULTS DO NOT REPRESENT ACTUAL TRADING. ALSO, SINCE THE TRADES HAVE NOT BEEN EXECUTED, THE RESULTS MAY HAVE UNDER-OR-OVER COMPENSATED FOR THE IMPACT, IF ANY, OF CERTAIN MARKET FACTORS, SUCH AS LACK OF LIQUIDITY. SIMULATED TRADING PROGRAMS IN GENERAL ARE ALSO SUBJECT TO THE FACT THAT THEY ARE DESIGNED WITH THE BENEFIT OF HINDSIGHT. NO REPRESENTATION IS BEING MADE THAT ANY ACCOUNT WILL OR IS LIKELY TO ACHIEVE PROFIT OR LOSSES SIMILAR TO THOSE SHOWN.

