

Crude Oil prices are a very important barometer of economic activity. In the past, the price of Crude Oil was an important determinant of inflation. From a political point of view, the price of Crude Oil is felt by every citizen when they fill up their cars with gasoline.
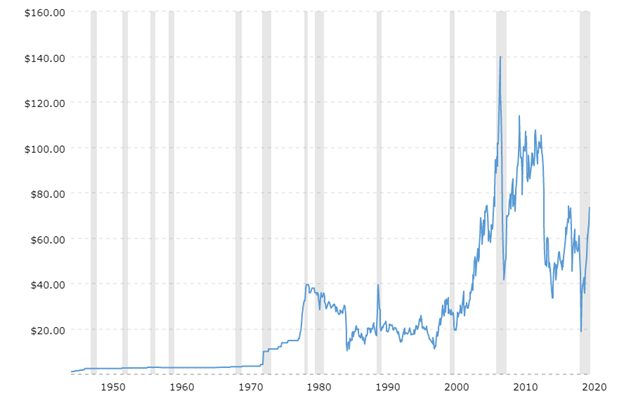
The long-term chart below of Crude Oil is worthy of every speculator study. The gray shaded areas are economic recessions. A perceived economic and political reality is sharp rises in Crude Oil prices often lead voters to vote against the incumbent party in elections.
Oil prices are influenced by a variety of factors, particularly the decisions about output made by producers like the Organization of Petroleum Exporting Countries (OPEC). The OPEC cartel is a consortium of 13 countries, made up of Algeria, Angola, Congo, Equatorial Guinea, Gabon, Iran, Iraq, Kuwait, Libya, Nigeria, Saudi Arabia, the United Arab Emirates, and Venezuela. These producers and their output are the primary drivers of Crude Oil prices.
OPEC controls almost 80% of the world’s supply of oil reserves. They set production levels to meet global demand which influences the price of oil and gas by increasing or decreasing production.
Oil prices have risen 34% so far this year.
While 2020 was a brutal year for the entire crude oil industry. The global travel lockdowns starting in mid-March resulted in the sharpest, most protracted collapse in global oil demand in history when the May WTI Crude futures contract fell to negative $40.32. At that time, a dispute between OPEC and Russia led to a flood of supply hitting the market while cost to store oil were very high.
Fast-forward to mid-2021, and the outlook is significantly different. While we are not out of the woods, global transportation has recovered, and people’s hopes of the end of the lockdown internationally continues to support the perspective that demand will continue to increase.
The three main reasons that have driven up the price of oil are that:
- Demand has risen as the economic lockdown and pandemic led to a huge curtailment in economic activity. As the end of the pandemic nears, oil demand is bouncing back.
- In 2021, Russia and OPEC are cooperating and reducing how much oil they bring to the market.
- Historically gasoline prices rise in summer when peak demand occurs.
Essentially there is increased demand for crude oil and refined products, and demand outpaces supply in the short term and long term.
The U.S. Energy Information Administration’s (EIA) has recently forecasted that Brent Crude Oil prices will average $68 a barrel in the third quarter of 2021 and $60 a barrel in 2022. This represents a 20% decline from current levels.
Over the past 8 months Crude Oil prices have doubled.
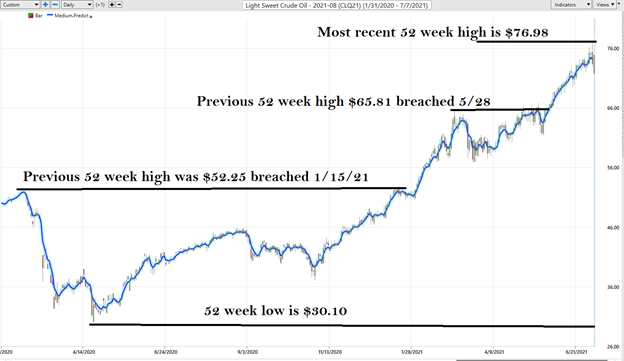
Let’s start our analysis with the commonsense metrics. Over the last 52 weeks Crude Oil has traded as high as $76.98 and as low as $30.10. This tells us that the annual trading range has been $46.88. The average weekly trading range is $.90. These baseline values become metrics that we look to greatly expand upon using the artificial intelligence.
When we study the charts, we start by analyzing where the market is in relationship to its 52-week high and low. Experience tells us that assets which successfully breach their 52-week highs on strong momentum tend to move higher, and vice-versa. The following 1-year Lumber chart shows the most recent 52-week high and low boundaries.
In trading when an asset breaks out to new all-time highs it clearly points out that something truly unusual has occurred. It might be a supply/demand imbalance or industry disruption. We pay attention to this metric on an annual basis, but we also caution traders to look at the charts from a much larger time frame because while these moves are rare, they are immensely powerful and profitable.
While we do not create a valuation based upon fundamental factors, we study them to understand the financial landscape that the asset is operating under. There is tremendous power in being aware of an asset when it is trading at 52-week highs. At these points we pay particularly close attention to the Vantagepoint A.I. forecast.
VantagePoint’s A.I. Analysis
Whenever we look at an asset forecast, we always are comparing what the stock has done, to the artificial intelligence, which is computing its forecast based upon a proprietary intermarket analysis of the most closely correlated assets as well as a neural network computation.
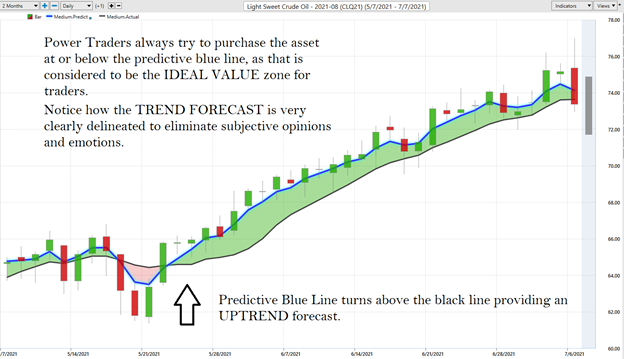
The key to the VantagePoint analysis is the predictive blue line. The slope and general direction of the blue line determines the medium forecast for the market.
The Vantagepoint Software has three separate modules which create a forecast for a Power Trader. They are the predictive blue line, the Neural Net, and the Intermarket Analysis.
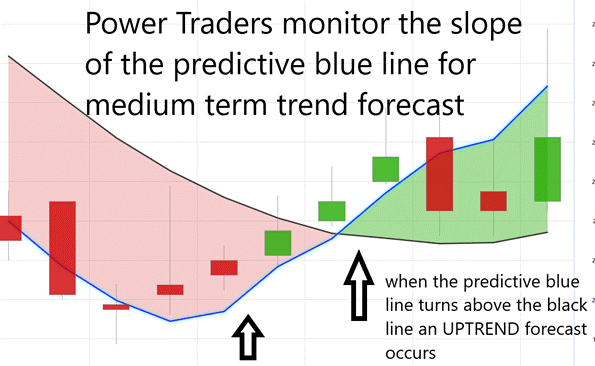
The predictive blue line also acts as a value zone wherein uptrends traders try to purchase the asset at or below the blue line. Power traders use the predictive blue line in helping to determine both the value zone as well as the trend direction.
The black line that you see is a regular simple 10-period moving average. It’s a good measure of where market prices have been over a given period of time. But as traders we really need to understand is where our market price is moving going forward.
To understand and appreciate how powerful this indicator is, take a look without any of the daily price bars on the chart for the last year.
- The slope of the predictive blue line determines the short-term trend.
On the following graphic, monitor that you would want to buy when the slope of the blue line is going up.
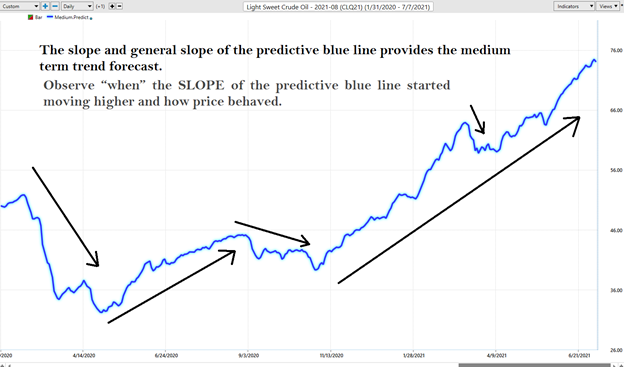
Observe “when” the SLOPE of the predictive blue line started moving higher and how price behaved.
Here is the same chart with the accompanying daily price bars for the last two months. As you look through this chart study how:
- Power Traders always try to find opportunities to purchase the asset at or below the predictive blue line, as that is the IDEAL VALUE zone for traders.
- Power Traders always try to find opportunities to sell the asset at or above the predictive blue line, as that is the IDEAL VALUE zone for traders.
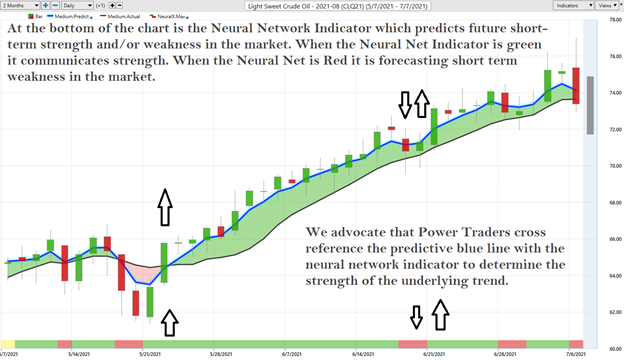
At the bottom of the chart is the Neural Network Indicator which predicts future short-term strength and/or weakness in the market. When the Neural Net Indicator is green it communicates strength. When the Neural Net is red it is forecasting short term weakness in the market.
We advocate Power Traders cross reference the chart with the predictive blue line and neural network indicator to create optimal entry and exit points.
Power Traders are always looking to apply both the neural network and A.I. to the markets to find statistically sound trading opportunities.
Power Traders have had multiple opportunities to exploit nice gains in Oil by monitoring the artificial intelligence forecasts. Over a period of 37 trading sessions prices increased over 100%.
Fine Tuning Entries and Exits
One of the powerful features in the VantagePoint Software which Power Traders use on a daily basis is the Price Range prediction forecast.
This forecast is what permits Power Traders to truly fine-tune their entries and exits into the market.
At 6:30 pm after the market closes, the software updates, and all of the price predictions change based upon what the machine learning, A.I., neural networks, and intermarket analysis anticipate moving forward.
Here is the price chart of Oil during the most recent runup featuring the Daily Price Range forecast with the NeuralNet Index at the bottom of the chart. Day traders who are looking for short-term swings in the markets focus on the daily price ranges to place their entry and exit orders.
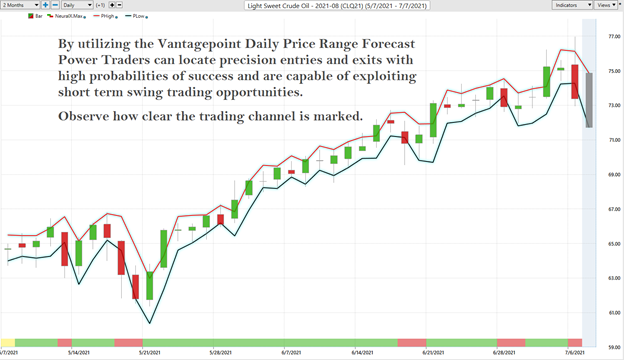
By utilizing both tools simultaneously, Power Traders can locate precision entries and exits with high probabilities of success and are capable of exploiting short-term swing trading opportunities.
Traders can use these VantagePoint tools either independently or together to find great trading opportunities. This is the power at your fingertips when you use artificial intelligence to do your trend analysis. The slopes of the price channels above clearly delineate the trends.
Intermarket Analysis of Crude Oil
We live in a global marketplace. Everything is interconnected. The billion-dollar question for traders is always what are the key drivers of price for the underlying asset that I am trading?
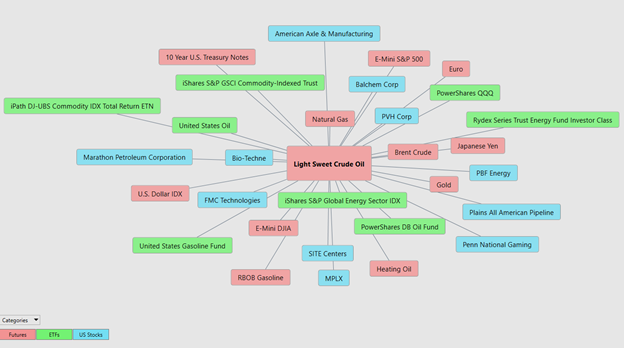
What makes VantagePoint unique and distinct when compared to all other analytical tools is its patented and proprietary intermarket analysis.
Intermarket analysis is a method of analyzing markets by examining the correlations between different asset classes. In other words, what happens in one market could, and probably does, affect other markets, so a study of the relationship(s) is often very helpful to a trader.
There is great value to be had in studying and understanding the key drivers of Crude Oil’s price action.
As the price of Crude Oil fluctuates it is very common to find trading opportunities in the major Oil producers as well as the refiners by studying the intermarket analysis. Often you can see a major ETF and by simply looking at the holdings of the ETF you spot diamonds in the rough who benefit greatly from a higher oil price.
Small changes in Interest rates, and the Volatility of the dollar amongst thousands of other variables affect the decisions companies must make to survive in these very challenging times. Trying to determine what these factors are is one of the huge problems facing investors and traders.
Instead of looking at financial markets or asset classes on an individual basis, intermarket analysis looks at several strongly correlated markets, or asset classes, such as other stocks, currencies, ETFs, and commodities. This type of analysis expands on simply looking at each individual market or asset in isolation by also looking at other markets or assets that have a strong relationship to the market or asset being considered. The VantagePoint software analyzes the top 31 drivers of an assets price. This analysis will often show ETF’s which are big owners of the underlying asset, but it will also uncover other markets which are statistically correlated to the trend you are analyzing. Traders often find other blossoming opportunities when engaging in Intermarket Analysis.
Our Suggestion For Crude Oil
Oil prices are UP more than 45% in the first seven months of 2021, rallying toward $77 a barrel for the first time in 30 months. There is a great divergence of opinion on the future of Crude Oil prices.
What next for Oil prices?
Goldman Sachs sees Crude prices averaging above $80 in the third quarter of 2021, with surges “well above” that level as demand comes roaring back. Other large institutional players like JPMorgan, expect crude oil prices to break into the $80 price range during the fourth quarter of 2021.
OPEC is benefiting greatly from higher Crude Oil prices and recouping some of the US $335 billion of revenue they ‘lost’ last year when the market collapsed.
We determine our trading behavior purely based upon the Vantagepoint A.I. forecast but we keep an open ear to see what the fundamentalists are saying simply to help us understand the canvas upon which the asset is trading.
Commodities are on a bull run this year. Inflationary pressures are present across the financial markets.
The past year has been about an unprecedented loss in global demand. We think OPEC will continue working to rebalance the Crude market by constraining supply as demand recovers.
We anticipate that the A.I. will be closing out or LONG positions shortly and we will be looking to get back in on the next UP forecast that the A.I. provides. Crude Oil is a wonderful swing trading asset. We have Crude on our trading radar and will use the A.I., machine learning and neural networks to position ourselves accordingly.
Let’s Be Careful Out There!
Remember, It’s Not Magic.
It’s Machine Learning.

IMPORTANT NOTICE!
THERE IS SUBSTANTIAL RISK OF LOSS ASSOCIATED WITH TRADING. ONLY RISK CAPITAL SHOULD BE USED TO TRADE. TRADING STOCKS, FUTURES, OPTIONS, FOREX, AND ETFs IS NOT SUITABLE FOR EVERYONE.
DISCLAIMER: STOCKS, FUTURES, OPTIONS, ETFs AND CURRENCY TRADING ALL HAVE LARGE POTENTIAL REWARDS, BUT THEY ALSO HAVE LARGE POTENTIAL RISK. YOU MUST BE AWARE OF THE RISKS AND BE WILLING TO ACCEPT THEM IN ORDER TO INVEST IN THESE MARKETS. DON’T TRADE WITH MONEY YOU CAN’T AFFORD TO LOSE. THIS ARTICLE AND WEBSITE IS NEITHER A SOLICITATION NOR AN OFFER TO BUY/SELL FUTURES, OPTIONS, STOCKS, OR CURRENCIES. NO REPRESENTATION IS BEING MADE THAT ANY ACCOUNT WILL OR IS LIKELY TO ACHIEVE PROFITS OR LOSSES SIMILAR TO THOSE DISCUSSED ON THIS ARTICLE OR WEBSITE. THE PAST PERFORMANCE OF ANY TRADING SYSTEM OR METHODOLOGY IS NOT NECESSARILY INDICATIVE OF FUTURE RESULTS. CFTC RULE 4.41 – HYPOTHETICAL OR SIMULATED PERFORMANCE RESULTS HAVE CERTAIN LIMITATIONS. UNLIKE AN ACTUAL PERFORMANCE RECORD, SIMULATED RESULTS DO NOT REPRESENT ACTUAL TRADING. ALSO, SINCE THE TRADES HAVE NOT BEEN EXECUTED, THE RESULTS MAY HAVE UNDER-OR-OVER COMPENSATED FOR THE IMPACT, IF ANY, OF CERTAIN MARKET FACTORS, SUCH AS LACK OF LIQUIDITY. SIMULATED TRADING PROGRAMS IN GENERAL ARE ALSO SUBJECT TO THE FACT THAT THEY ARE DESIGNED WITH THE BENEFIT OF HINDSIGHT. NO REPRESENTATION IS BEING MADE THAT ANY ACCOUNT WILL OR IS LIKELY TO ACHIEVE PROFIT OR LOSSES SIMILAR TO THOSE SHOWN.

