
One of the fascinating things about Fed watching is that you begin to recognize how short of a memory span everybody in the financial media has. In 2008, during the Great Financial Crisis, Fed Chairman Ben Bernanke stated that the economy needed a ONE TIME (emphasis mine) stimulus of $600 billion to save the banking system.
Then immediately thereafter, the Fed went on to create:
- Quantitative Easing 1
- Quantitative Easing 2
- Quantitative Easing 3
- Quantitative Easing Infinity
And untold amounts of stimulus to prevent the system from collapsing. Currently their balance sheet has over $8 trillion of assets on it. During the Great Financial Crisis, it only had $800 billion.
So much for a ONE-TIME stimulus!
Today the Fed is buying $120 billion dollars a month of US Bonds for reasons laid out later in this article.
You would think that at some point, someone would ask why the economy needs all this new liquidity, all the time, when previous to 2008 it did not.
What changed?
Over the past year when the economy was locked down due to COVID-19. The Treasury and the Fed created trillions in Helicopter Money Stimulus to support the economy. Critics warned of inflationary headwinds and referred to the stimulus as currency debasement. The Fed, through Jerome Powell, assured us that they were vigilant, in control and they would hit their 2% inflation target.
While nobody knows over what timeframe the 2% inflation target is measured, recent announcements by the Bureau of Labor Statistics have many very worried that a 1970’s style inflation is back in full swing. Why?
Let’s look at some of the recent economic numbers for the Consumer Price Index and the Producer Price Index.
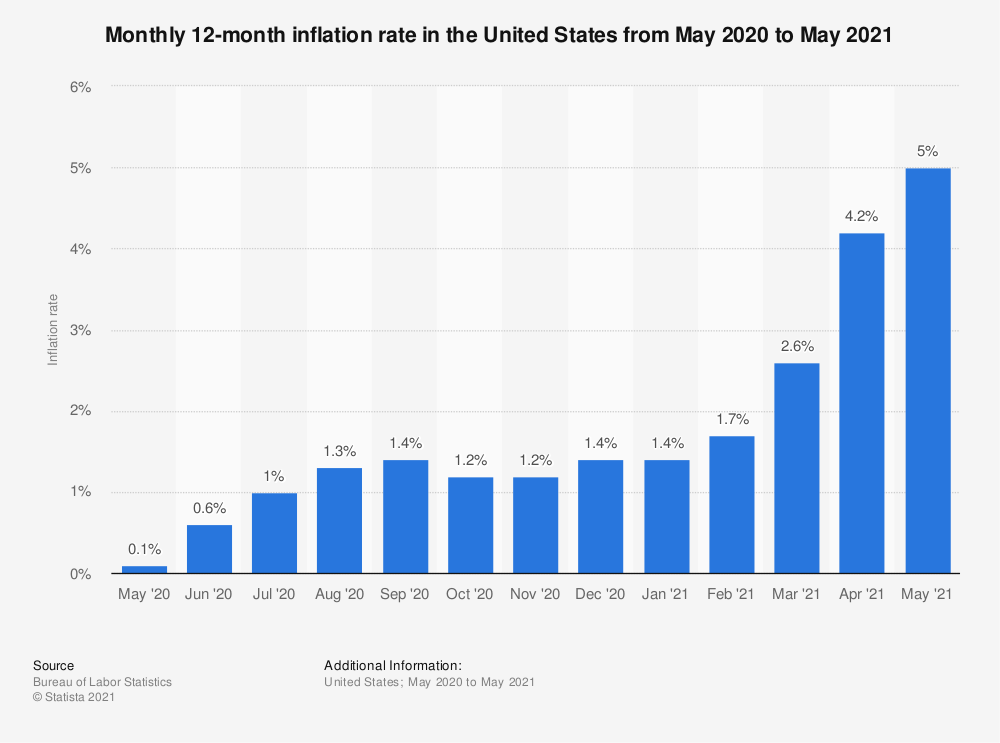
On July 13, 2021, the CPI numbers came in at 5.4% for June, which was 10% higher than the mainstream economists had forecasted. What makes this noteworthy is that a miss by 10% is an impressive feat given they spend all day creating econometric models to understand what is happening in the economy.
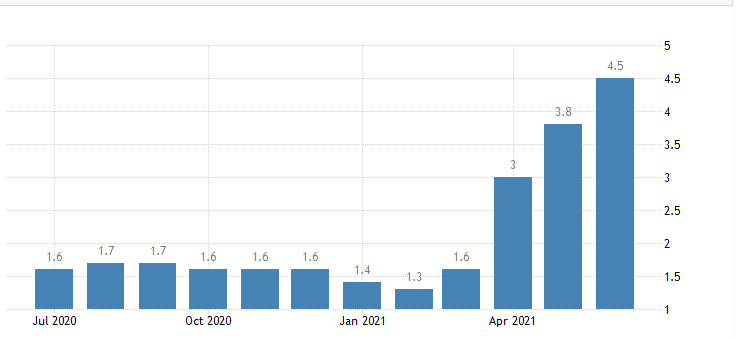
When you remove the food and energy from the mix, core inflation rose to 4.5% for the month of June. That makes the June CPI is the highest it has been in 13 years and core inflation is as high as it has been since 1991.
The core inflation rate below speaks for itself.
Since 78% of Americans live paycheck to paycheck, this monthly jump in inflation can be quite terrifying to those who do not have the resources to withstand the type of financial storm which inflation brings about.
Then, to make matters worse, yesterday the Producer Price Index numbers were released, and they showed an even greater inflationary concern. Wholesale prices rose 7.3% in June on a year over year basis. This is another indicator inflation is moving faster than the markets had anticipated. Faster and further than the Feds 2% inflation target.
Once again let’s allow the chart to speak on its own:
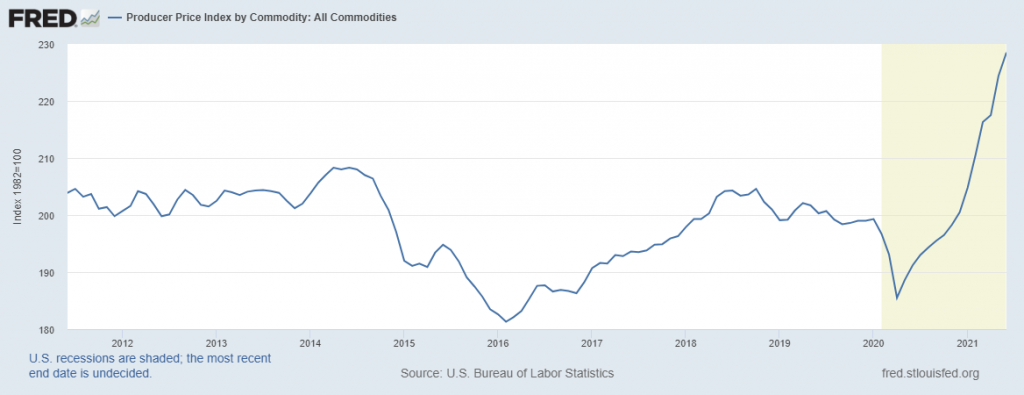
This chart created by the Fed goes back TEN years. Any seasoned trader looking at this chart of Producer Prices, would have to conclude that a BREAKOUT has occurred. Seems like we just rocketed through that 2% inflation rate that the Fed “assured us” was their target.
Why is this of concern? There are several reasons, but one of the main factors is THE REAL RATE of RETURN. This metric is calculated by looking at the yield of the Ten-Year Bond and Subtracting the Core Inflation rate.
The 10 Year Bond is yielding 1.321%
Core Inflation was 4.5%
That makes the Real Return on 10 Year U.S. Treasuries -3.179%.
Who do you know that will invest in the Ten-Year Bond to guarantee a greater than 3% loss? What makes this so tragic is that bond investors would still have to pay Capital Gains Taxes on the +1.321% positive yield. So, the absolute real rate of return after taxes is even worse.
This metric in and of itself describes why the Fed is buying $120 billion of Treasury Bonds every month and putting them on their balance sheet. What rationale is there for any investor of sound mind to commit to an investment guaranteed to lose money?
But the greater confusion facing all investors and traders is where do they run for safety?
Traditionally, investors and traders would run to short term money market funds, or Treasury Bonds when they wanted to eliminate risk. But since the Fed lowered interest rates to zero, and their continuous interference in the markets, there is no place to run for guaranteed protection of purchasing power and safety of principal.
Anyone who invests in U.S. Treasuries will get their principal back, but there is now significant concern about what the purchasing power will be.
And herein lies the recipe for the “EVERYTHING BUBBLE” we are witnessing in the financial markets. People want to park their funds someplace and eliminate risk. The choices are limited and describe the insanity of the current financial environment.
Treasury Instruments (guaranteed loss of purchasing power)
Real Estate (speculative – unless it’s your primary residence)
Precious Metals – have lost several % over the last year.
Stocks – The Blue chips continue to perform well. It is hard to rationalize that the consensus inflation hedge trade has become tech stocks. That is where we are right now. Investors are piling into tech with the hopes that tech can outgrow the inflationary pressures that are being pushed by central banks around the world.
Cryptocurrencies – Even after the huge drawdown Bitcoin is up 300% in the last 9 months but the entire cryptoverse is extremely volatile.
What’s left?
The narrative battle rages on and like any good drama you have the antagonists beginning to throw stones at our lead character, Fed Chairman, Jerome Powell.
BlackRock has become the LARGEST money manager in the world with $6.84 trillion under management. CEO, Larry Fink was on CNBC yesterday explaining that he doesn’t believe the current inflation levels are “transitory.”
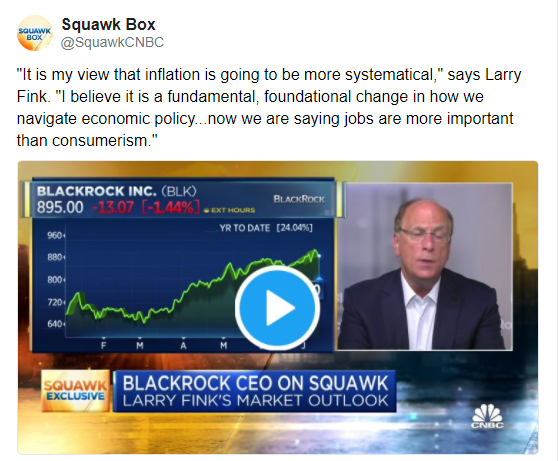
Fink elaborated those savers are being punished and asset owners are being rewarded by the current monetary policy. It’s very unusual to see this because BlackRock is who the Fed uses to purchase assets which end up on the Fed’s books.
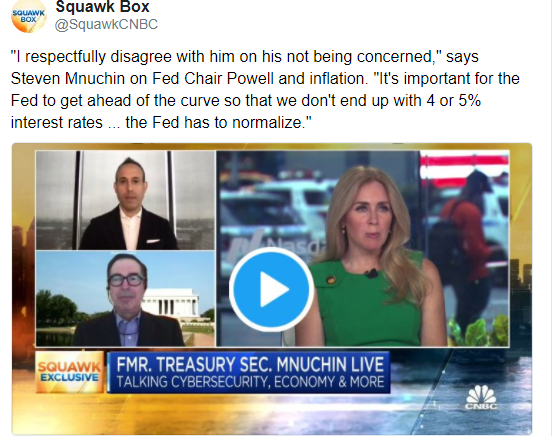
Next, is Former Treasury Secretary Steven Mnuchin stated that he does not believe that the current inflation is “transitory” either.
Meanwhile, our protagonist, Fed Chairman, Jerome Powell is hedging his “inflation will be transitory” narrative of the past year by now stating that consumer prices have “increased substantially” and are likely to “remain elevated” in the coming months, marking a noticeable change in tune from his longtime insistence that recent inflation will only be transitory. This also questions the ability of the Fed to stop the momentum of inflation once it has been unleashed on the economy.
This story certainly makes for a wonderful TV drama.
But as an investor or trader, the only thing that matters is how you protect and grow your purchasing power. This is no easy task in the current financial environment.
Simply look at Warren Buffett’s favorite indicator which he crafted to avoid being on the wrong side of the market at the wrong time. The Buffett indicator measures the value of the Wilshire 5000 Index and compares it to the GDP of the United States.
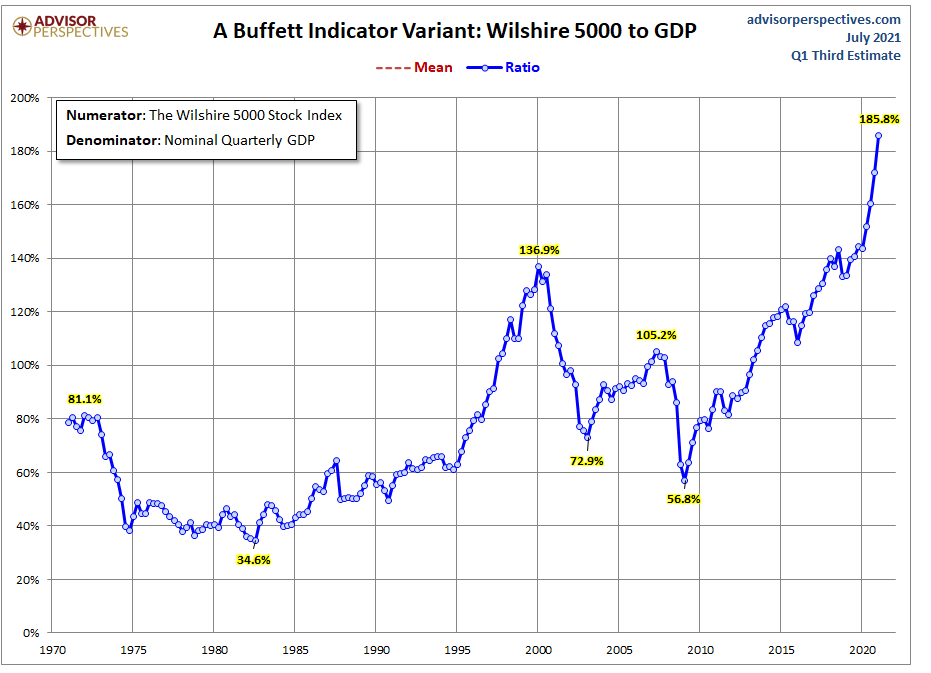
Regardless of how you look at it, you can see that we are completely in uncharted waters. We are approaching levels 60% higher than the peak of the dot-com bubble bust in 2000.
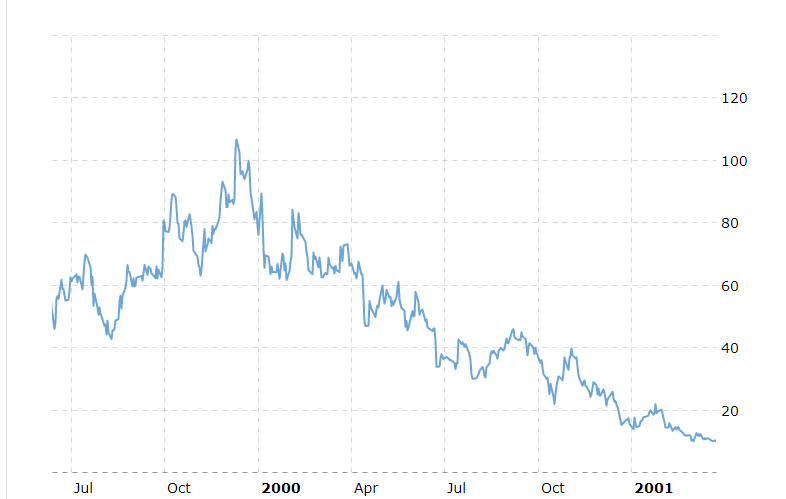
In 2000, the dot-com bubble burst, destroyed $6.2 trillion in household wealth over the next two years as many tech darlings got obliterated. Even Amazon lost 90% of its value.
As an investor and trader, how do you go about making sense of it all?
As a trader, the most important question on your mind is “How do I protect the purchasing power of my portfolio?”.
Finding value is becoming a completely consuming activity on the part of traders and investors. The target moves quickly based upon too many factors that remain unseen to the naked eye.
It’s all about getting on the right side, of the right trend at the right time.
Most traders have problems with the timing of their trades.
If you want to win, it’s all about who has the best tools. Artificial intelligence excels at keeping traders on the right side of the right trend at the right time.
Let’s get candid here:
- The market is brutally honest – there are winners and losers.
- It’s very black and white.
- If you need a friend, get a dog.
- If you are going to win, someone else must lose.
- If survival of the fittest makes you uneasy, stay out of the financial markets.
We live in unique times. The Printing Press is diluting the value of your money.
Everyone is aware that if the money supply grows 20% you must grow your portfolio by that amount just to break even when you look at your purchasing power.
Since artificial intelligence has beaten humans in Poker, Chess, Jeopardy and Go! do you really think trading is any different?
How do you think your investment portfolio compares when pitted against artificial intelligence?
Are you capable of finding those markets with the best risk/reward ratios out of the thousands of trading opportunities that exist?
Knowledge. Useful knowledge. And its application is what A.I. delivers.
You should find out. Join us for a FREE, Live Training. We’ll show you at least three stocks that have been identified by the A.I. that are poised for big movement… and remember, movement of any kind is an opportunity for profits!
Discover why artificial intelligence is the solution professional traders go-to for less risk, more rewards, and guaranteed peace of mind.
Visit with us and check out the A.I. at our Next Live Training.
Discover why Vantagepoint’s artificial intelligence is the solution professional traders go-to for less risk, more rewards, and guaranteed peace of mind.
It’s not magic. It’s machine learning.
Make it count.

IMPORTANT NOTICE!
THERE IS SUBSTANTIAL RISK OF LOSS ASSOCIATED WITH TRADING. ONLY RISK CAPITAL SHOULD BE USED TO TRADE. TRADING STOCKS, FUTURES, OPTIONS, FOREX, AND ETFs IS NOT SUITABLE FOR EVERYONE.
DISCLAIMER: STOCKS, FUTURES, OPTIONS, ETFs AND CURRENCY TRADING ALL HAVE LARGE POTENTIAL REWARDS, BUT THEY ALSO HAVE LARGE POTENTIAL RISK. YOU MUST BE AWARE OF THE RISKS AND BE WILLING TO ACCEPT THEM IN ORDER TO INVEST IN THESE MARKETS. DON’T TRADE WITH MONEY YOU CAN’T AFFORD TO LOSE. THIS ARTICLE AND WEBSITE IS NEITHER A SOLICITATION NOR AN OFFER TO BUY/SELL FUTURES, OPTIONS, STOCKS, OR CURRENCIES. NO REPRESENTATION IS BEING MADE THAT ANY ACCOUNT WILL OR IS LIKELY TO ACHIEVE PROFITS OR LOSSES SIMILAR TO THOSE DISCUSSED ON THIS ARTICLE OR WEBSITE. THE PAST PERFORMANCE OF ANY TRADING SYSTEM OR METHODOLOGY IS NOT NECESSARILY INDICATIVE OF FUTURE RESULTS. CFTC RULE 4.41 – HYPOTHETICAL OR SIMULATED PERFORMANCE RESULTS HAVE CERTAIN LIMITATIONS. UNLIKE AN ACTUAL PERFORMANCE RECORD, SIMULATED RESULTS DO NOT REPRESENT ACTUAL TRADING. ALSO, SINCE THE TRADES HAVE NOT BEEN EXECUTED, THE RESULTS MAY HAVE UNDER-OR-OVER COMPENSATED FOR THE IMPACT, IF ANY, OF CERTAIN MARKET FACTORS, SUCH AS LACK OF LIQUIDITY. SIMULATED TRADING PROGRAMS IN GENERAL ARE ALSO SUBJECT TO THE FACT THAT THEY ARE DESIGNED WITH THE BENEFIT OF HINDSIGHT. NO REPRESENTATION IS BEING MADE THAT ANY ACCOUNT WILL OR IS LIKELY TO ACHIEVE PROFIT OR LOSSES SIMILAR TO THOSE SHOWN.

