

This week’s stock analysis is Adobe (ADBE).
Originally called Adobe Systems Incorporated, Adobe is an American multinational computer software company. Incorporated in Delaware and headquartered in San Jose, California, it has specialized in software for the creation and publication of content, including graphics, photography, illustration, animation, multimedia/video, motion pictures, and print. Flagship products include Photoshop image editing software, Adobe Illustrator vector-based illustration software, Adobe Acrobat Reader, and the Portable Document Format (PDF), plus a host of tools primarily for audio-visual content creation, editing, and publishing. The company began by leading in the desktop publishing revolution of the mid-1980’s, went on to lead in animation and multi-media through its acquisition of Macromedia.
Over the past three years, the company has experienced explosive growth. It has posted double-digit earnings growth and 10-straight quarterly earnings surprises. For its fourth quarter in fiscal year 2020, Adobe Systems reported 14% year-over-year revenue growth and 22.7% year-over-year earnings growth. Fourth-quarter earnings of $2.81 per share topped analysts’ estimates for $2.66 per share.
The company has Powerful Sales growth, expanding operating margin growth, and history of outperforming analysts’ expectations. The stock has been a long-term winner, up 100% in the last three years and 400% in the last five years. In both cases, those gains beat the S&P 500 by a wide margin.
Adobe is widely known for its software offerings, especially its Acrobat Pro software for creating, editing, and sending PDF documents.
However, there is much more to ADOBE than just its popular PDFs. Adobe Systems has three business segments: Digital Media, Digital Experience, and Publishing. Applications like Photoshop, Illustrator, Premiere Pro, and After Effects are virtually unrivaled in terms of market share.
ADBE stock recently hit an all-time high after the company released its second-quarter earnings report. The company’s revenue rose 23% year over year to $3.84 billion, beating estimates by $110 million. Its adjusted net income also rose 23% to $1.46 billion, or $3.03 per share, which surpassed expectations by $0.21 a share.
Adobe’s insiders have acquired more than twice as many shares as they sold over the previous six months. That confidence suggests the stock has much more upside room and is probably considered cheap relative to its long-term growth potential. Since ADBE has massively outperformed the S&P 500 over the past several years we expect that as the Indexes goes to new highs that ADBE will continue to outperform.
Adobe was founded in December 1982. They have 21,000 employees worldwide. Its stock trades on the NASDAQ and averages 2.1 million shares a day.
Analysts Ratings of Adobe (ADBE)
The 22 analysts offering 12-month price forecasts for Adobe Inc have a median target of 634.00, with a high estimate of 700.00 and a low estimate of 550.00. The median estimate represents a +4.71% increase from the last price of 605.47. The current consensus among investment analysts is to buy stock in Adobe Inc. This rating has held steady throughout 2021. Analysts have not raised their recent estimates of ADBE even based upon its recent strong performance.
Let’s start off with the common-sense metrics and an annual look at the chart of ADOBE (ADBE).
Common-Sense Metrics
Over the last 52 weeks ADBE has traded as low as $416.29 and as high as 609.33. This provides us with an annual trading range of $193.04 which represents almost 32% of its current price. When we divide this value by 52 weeks, we come up with an average weekly trading range of $3.71. This metric, on a very broad basis, only helps define what normal weekly stock movement is. We look to greatly amplify these baseline common-sense metrics by using the Vantagepoint Software with the artificial intelligence.
Using A.I. we look to capture many times that value during the time we are trading this particular asset.
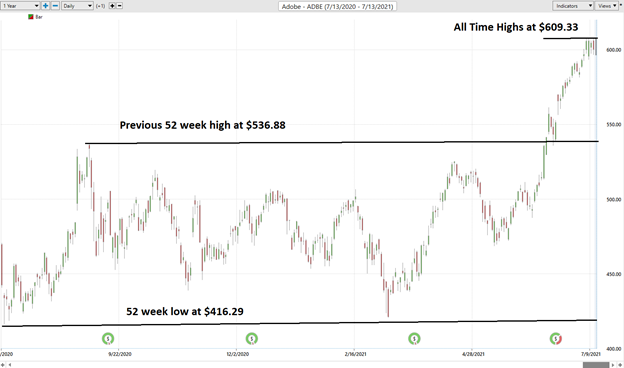
We are advocates of becoming extremely aware, at all times of the 52-week trading range of any stock that we are looking to either trade or invest in. The 52-week high boundary often acts as major resistance to a stock advance until it is breached. Once a stock successful closes above its 52-week high, it is very common for a stock to continue to move higher. We do not take this on faith and discuss it in all of our analysis. When you study the 52-week chart notice how the 52-week high acted as significant resistance throughout the last 12 months. The previous 52 week high was breached on June 11, 2021, and has rallied over 10% in the last 24 trading sessions.
The VantagePoint Analysis
Whenever we look at an asset forecast, we always are comparing what the stock has done, to the artificial intelligence, which is computing its forecast based upon a proprietary intermarket analysis of the most closely correlated assets as well as a neural network computation.
The key to the VantagePoint analysis is the predictive blue line. The slope and general direction of the blue line determines the medium forecast for the market.
The VantagePoint Software has three separate modules which create a forecast for a Power Trader. They are the predictive blue line, the Neural Net, and the Intermarket Analysis.
The predictive blue line also acts as value zone where in uptrends traders may try to purchase the asset at or below the blue line. Power traders use the predictive blue line in helping to determine both the value zone as well as the trend direction.
To understand and appreciate how powerful this indicator is, we’ll remove the daily price bars on the chart.
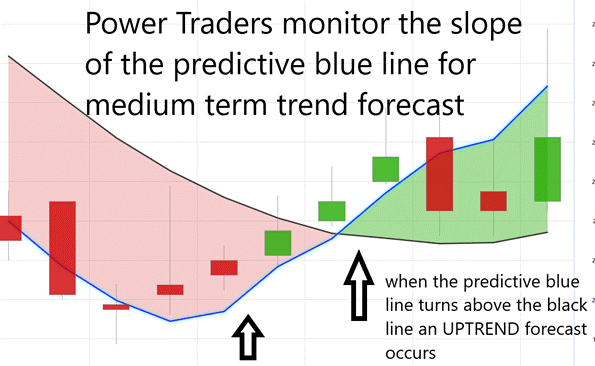
- The slope of the predictive blue line determines the short-term trend. On the following graphic, you would want to look for opportunities to buy when the slope of the blue line is going up.
Here is the price chart of ADBE between 4/13/21 and 7/13/21 –
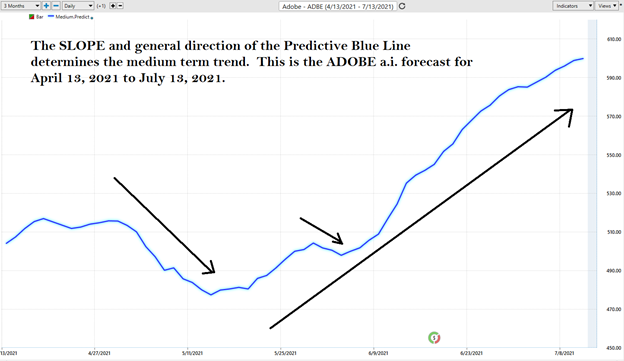
Observe “when” the SLOPE of the predictive blue line started moving higher and how price behaved.
Here is the same chart with the accompanying daily price bars. As you look through this chart study the following:
- Power Traders always try to look for opportunities to purchase the asset at or below the predictive blue line, as that is considered to be the IDEAL VALUE zone for traders.
- Power Traders always try to look for opportunities to sell the asset at or above the predictive blue line, as that is considered to be the IDEAL VALUE zone for traders.
- The black line is just a simple 10 day moving average. It is a popular technical indicator to tell you what has occurred in the market. When the predictive blue line turns above the black line the A.I. forecast is considered to be UP. When the predictive blue line turns below the black line the trend is considered to be DOWN.
At the bottom of the chart is the Neural Network Indicator which predicts future short-term strength and/or weakness in the market. When the Neural Net Indicator is green it communicates strength. When the Neural Net is Red it is forecasting short term weakness in the market.
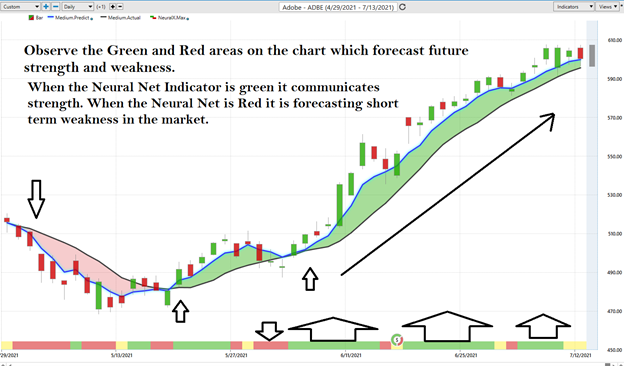
We advocate that Power Traders cross reference the chart with the predictive blue line and neural network indicator to create optimal entry and exit points. When both the medium-term forecast is accompanied by a GREEN Neural Network forecast the expectation is that prices will rise.
Observe how traders who acted upon only these two indicators are banking profits of 20% in the last 26 trading sessions.
Power Traders are always looking to apply both the neural network and A.I. to the markets to find statistically sound trading opportunities.
Fine Tuning Entries and Exits of Adobe (ADBE)
One of the powerful features in the VantagePoint Software which Power Traders use on a daily basis is the Price Range prediction forecast.
This forecast is what permits Power Traders to truly fine tune their entries and exits into the market.
At 6:30pm after the market close the software updates and all the price predictions change based upon what the machine learning, A.I., neural networks, and intermarket analysis anticipate moving forward.
Here is the price chart of ADBE during the most recent runup featuring the Daily Price Range forecast with the NeuralNet Index at the bottom of the chart. Day traders who are looking for short term swings in the markets focus on the daily price ranges to place their entry and exit orders.
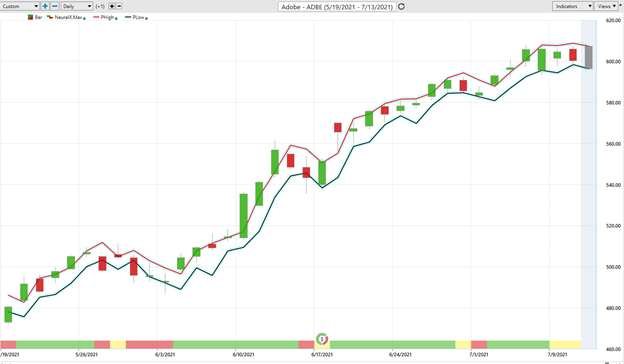
By utilizing both tools simultaneously, Power Traders can locate precision entries and exits with high probabilities of success and can exploit short term swing trading opportunities. Observe how the predicted trading channel clearly delineates the price trend as well.
When buying, many Power Traders often use a price level below the predictive low price to place their protective sell stops in the market in case a sudden reversal was to occur. When selling, many Power Traders use a price level above the predictive high to place their protective sell stops.
Traders use these VantagePoint tools either independently or together to find great trading opportunities. This is the power at your fingertips when you use artificial intelligence to do your trend analysis.
We live in a global marketplace. Everything is interconnected. The billion-dollar question for traders is always what are the key drivers of price for the underlying asset that I am trading?
Adobe (ADBE) Intermarket Analysis
What makes VantagePoint unique and distinct when compared to all other analytical tools is its patented and proprietary intermarket analysis.
Intermarket analysis is a method of analyzing markets by examining the correlations between different asset classes. In other words, what happens in one market could, and probably does, affect other markets, so a study of the relationship(s) is often very helpful to a trader.
There is great value to be had in studying and understanding the key drivers of ADBE’s price action.
Small changes in Interest rates, Crude Oil Prices, and the Volatility of the dollar amongst thousands of other variables affect the decisions companies must make to survive in these very challenging times. Trying to determine what these factors are is one of the huge problems facing investors and traders.
These factors are all displayed from a standpoint of statistical correlations which show the strongest interconnectedness of prices.
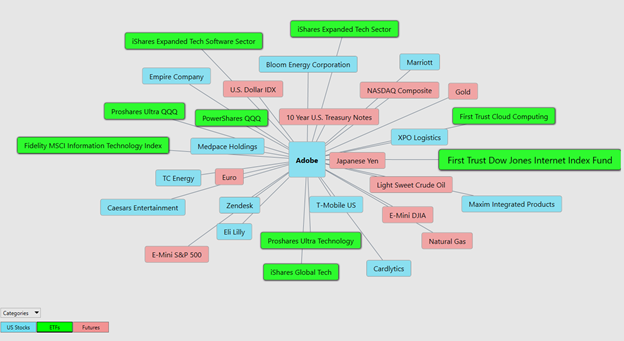
The blue rectangles represent the US stocks most statistically correlated to ADBE’s price action.
The green rectangles represent the ETF’s most statistically correlated to ADBE’’s price action.
The red rectangles represent the futures contracts most statistically correlated to ADBE’s price action.
Instead of looking at financial markets or asset classes on an individual basis, intermarket analysis looks at several strongly correlated markets, or asset classes, such as other stocks, currencies, ETFs, and commodities. This type of analysis expands on simply looking at each individual market or asset in isolation by also looking at other markets or assets that have a strong relationship to the market or asset being considered. The VantagePoint software analyzes the top 31 drivers of an assets price. This analysis will often show ETF’s which are big owners of the underlying asset, but it will also uncover other markets which are driving the trend you are analyzing. Traders often find other blossoming opportunities when engaging in Intermarket Analysis.
Our Trading Suggestion for Adobe
We approach our analysis not from a fundamental valuation perspective but from a pure trader’s viewpoint.
ADOBE is growing earnings and revenue. When we look at a stock, we evaluate it strictly from a technical perspective based upon the artificial intelligence forecast. We pay attention to the fundamental story to better understand the financial canvas that the stock is operating under.
By traditional analyst’s valuation methods ADBE is still undervalued even as it as recently made new all-time highs. Since we are short-term oriented in our outlook, we look at the opportunity to purchase sharp pullbacks in the price action and then look to sell when the A.I. determines the stock is overvalued.
Currently, the trend is clearly UP. Power Traders, who are in at lower prices, have moved their protective sell stops up to the bottom of the trading channel as a defensive measure.
The consensus of analysts’ opinions shows that ADBE is fairly valued around $634. With the stock currently trading around $606 we think it is a good swing trading candidate. We advise that Power Traders pay very close attention to the A.I. daily range forecast and look to acquire ADBE on pullbacks and sell the stock on strength. Our expectation is that the recent highs at $609.33 will soon give way to more upside potential.
Aggressive option traders who are experienced with SELLING PUT options may want to explore selling AT THE MONEY puts as volatility increases in this stock.
ADBE is a great swing trading stock with a strong uptrend at the present time. We have it firmly on the radar and look for opportunities to buy weakness with stops below the lows of the current A.I. daily forecast. As new 52-week highs are made, we anticipate greater volatility in the price action. ADBE has greatly outperformed the major stock market indices and we expect that it will continue to do so moving forward.
Our advice: Follow the A.I. trend analysis and practice good money management on all your trades.
We anticipate that ADBE will break to new 52-week highs to confirm to long-term value investors that it is the real deal.
We have had it on our radar many times over the past year and will continue to monitor it for solid trading opportunities.
The Vantagepoint A.I. forecast has been very accurate on ADBE. We think it will present us with multiple opportunities over the remainder of 2021.
Let’s Be Careful Out There!
Remember, It’s Not Magic.
It’s Machine Learning.

IMPORTANT NOTICE!
THERE IS SUBSTANTIAL RISK OF LOSS ASSOCIATED WITH TRADING. ONLY RISK CAPITAL SHOULD BE USED TO TRADE. TRADING STOCKS, FUTURES, OPTIONS, FOREX, AND ETFs IS NOT SUITABLE FOR EVERYONE.
DISCLAIMER: STOCKS, FUTURES, OPTIONS, ETFs AND CURRENCY TRADING ALL HAVE LARGE POTENTIAL REWARDS, BUT THEY ALSO HAVE LARGE POTENTIAL RISK. YOU MUST BE AWARE OF THE RISKS AND BE WILLING TO ACCEPT THEM IN ORDER TO INVEST IN THESE MARKETS. DON’T TRADE WITH MONEY YOU CAN’T AFFORD TO LOSE. THIS ARTICLE AND WEBSITE IS NEITHER A SOLICITATION NOR AN OFFER TO BUY/SELL FUTURES, OPTIONS, STOCKS, OR CURRENCIES. NO REPRESENTATION IS BEING MADE THAT ANY ACCOUNT WILL OR IS LIKELY TO ACHIEVE PROFITS OR LOSSES SIMILAR TO THOSE DISCUSSED ON THIS ARTICLE OR WEBSITE. THE PAST PERFORMANCE OF ANY TRADING SYSTEM OR METHODOLOGY IS NOT NECESSARILY INDICATIVE OF FUTURE RESULTS. CFTC RULE 4.41 – HYPOTHETICAL OR SIMULATED PERFORMANCE RESULTS HAVE CERTAIN LIMITATIONS. UNLIKE AN ACTUAL PERFORMANCE RECORD, SIMULATED RESULTS DO NOT REPRESENT ACTUAL TRADING. ALSO, SINCE THE TRADES HAVE NOT BEEN EXECUTED, THE RESULTS MAY HAVE UNDER-OR-OVER COMPENSATED FOR THE IMPACT, IF ANY, OF CERTAIN MARKET FACTORS, SUCH AS LACK OF LIQUIDITY. SIMULATED TRADING PROGRAMS IN GENERAL ARE ALSO SUBJECT TO THE FACT THAT THEY ARE DESIGNED WITH THE BENEFIT OF HINDSIGHT. NO REPRESENTATION IS BEING MADE THAT ANY ACCOUNT WILL OR IS LIKELY TO ACHIEVE PROFIT OR LOSSES SIMILAR TO THOSE SHOWN.

