

Last week’s Commentary showed a forecast for an expected high in the Dow near Monday, 4/21/14. Last week’s high came on Tuesday, one day later than expected. This week I will attempt to use my “Hybrid” Lindsay model to forecast the next low in the Dow. The Hybrid Lindsay model is my own approach to forecasting intermediate highs and lows which, as far as we know, Lindsay never published any forecasts. This model draws heavily on the work of George Lindsay.
Basic Cycle
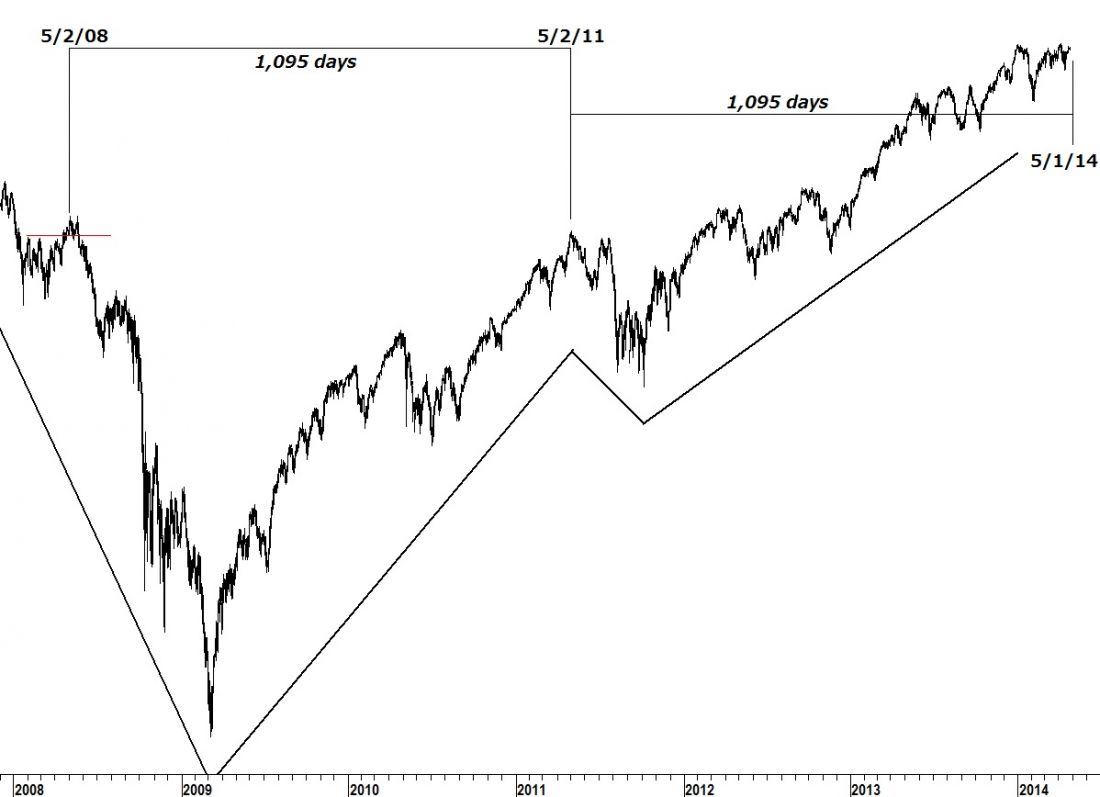
Centering a Middle Section forecast on the high of the previous basic cycle on 5/2/11, we find the high of a flattened top on 5/2/08. This measuring point on 5/2/08 lies 1,095 days prior to the turning point on 5/2/11.
Counting 1,095 days beyond the turning point produces a forecast (from the basic cycle) for a low on 5/1/14.
Multiple Cycle
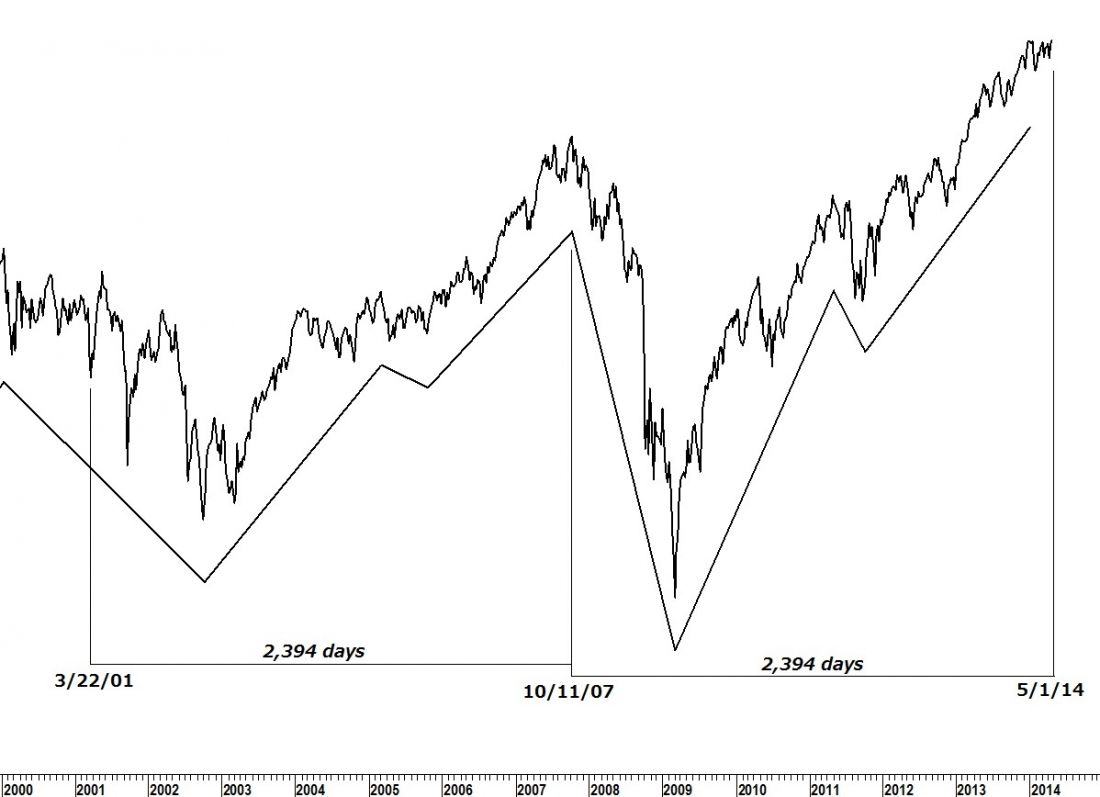
Centering a Middle Section forecast on the high of the multiple cycle on 10/11/07, we find a significant low on 3/22/01. This low counts 2,394 days to the turning point on 10/11/07.
Counting 2,394 days beyond the turning point produces a mirror image forecast (from the multiple cycle) for a low on 5/1/14 thus confirming the forecast from the basic cycle.
As seen with last week’s forecast, the model isn’t always exact but it is pretty close. I look for the Dow to be in a downtrend all week before finding a low sometime between this Thursday and the following Monday.
= = =
Get your copy of the April Lindsay Report at SeattleTA.

