There is on old phrase, people sell stock for all sorts of reasons, but only buy them for one reason.
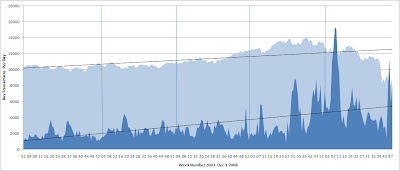
I am a follower of insider trading, there is just too many companies to look at out there, insider trading can help raise a company onto my radar. I thought I would put up this chart I put together. Fore color are the number of transactions made by insiders (according to SEC data) back color is the Dow Jones (for reference purposes).
- Interesting to see that when things start to go sideways or down is when insiders get hungry to buy up their company’s stock. In fact whenever there is a downturn in the DOW within 4 weeks we see insiders snapping up their companies stock.
- Looks like the insiders called the bottom wrong in February of this year when they had a big buy in.
- If we think about this as a CEO Confidence Index it is pretty easy to see they were shaken last month with one of the lowest trade weeks they have had in 2 years.
- Also interesting to see they have heated up again though in the last 4 weeks on a buying frenzy.
- As trading of this sort is only registered for buying in your own company a surge of buying would indicate to the layman that these company representatives have confidence in their own companies. Being most intimately familiar with the health of their own companies they seem to be resoundingly saying that they think their company is undervalued.
If we drop a trend line across the two we see that as the DOW goes up so to do the buy rates on insiders.
Lots of other things I could say here about these chart but would love to hear some of your own thoughts out there.


