
Austrian economists Ludwig von Mises and Friedrich von Hayek were two of the most prominent critics of the fiat monetary system and advocates of the gold standard. Their Austrian School of Economics placed them at odds with the majority of other economists, who favored government intervention in the economy. However, Mises and Hayek’s views gradually gained some acceptance, and their work was instrumental in shaping modern economic thought. In 1974, Hayek was awarded the Nobel Prize in Economics “for his pioneering work in the theory of money and economic fluctuations and for his penetrating analysis of the interdependence of economic, social, and institutional phenomena.” Mises, who died in 1973, was never awarded the Nobel Prize, but his work was widely respected by his peers. Austrian economics remains a controversial school of thought, but there is no doubt that Mises and Hayek were two of its most influential thinkers.
Austrian economists have long argued that the Federal Reserve is the source of the boom-and-bust business cycle. They contend the Fed’s actions lead to artificial ups and downs in the economy, rather than allowing the natural forces of supply and demand to determine prices. Austrian economists point to the availability of credit as one of the key drivers of these cycles.
The Austrian Business Cycle Theory was developed by von Mises in the early 20th century. It posits that the business cycle is caused by the actions of The Fed. When The Fed makes it easy for banks to get money (by lowering interest rates), it leads to a credit expansion. As credit is expanded in the economy, businesses create more inventory, hire more workers, and take on additional debt to service the artificial boom that has been created. This “easy money” encourages businesses to make investments that would not be profitable under normal economic conditions. These so-called “malinvestments” lead to economic activity that is not sustainable in the long run. When the central bank eventually raises interest rates and contracts the money supply, these malinvestments are exposed, leading to an economic downturn.
In essence, the Fed does a rug pull on the entire economy. Businesses love the cheap, easy credit and conditions and the boom they create. But as the economy gets red hot, and inflation begins to rear its ugly head, the Fed comes in and increases interest rates and reduces the availability of credit. On Wall Street, Fed watchers refer to this action as the Fed removing “the punchbowl from the party.”
Von Mises likened the Fed’s credit expansion to “a man pouring gasoline on a fire in order to put it out.” In other words, while The Fed’s actions may appear to be helpful in the short-term, they end up exacerbating the problem and leading to a more severe recession.
The result is businesses must confront the reality of their balance sheets and discover that the boom was artificial. The result is layoffs and economic contraction.
When credit is easy to come by, businesses and consumers are more likely to borrow and spend. This increases demand for goods and services, leading to higher prices. However, this borrowing eventually leads to an increase in the money supply, which leads to inflation. As inflation increases, people begin to expect higher prices, leading them to spend less and save more. This decrease in spending leads to a decrease in demand, leading to lower prices. The cycle then repeats itself as the Fed tries to stimulate economic activity through lowering interest rates and increasing the money supply. Austrian economists argue that this process is inherently unstable and that it leads to regular cycles of Boom and Bust. According to Austrian theory, the business cycle is driven by changes in the availability of credit. When credit is easy to obtain, businesses expand and invest more heavily, leading to an economic boom. However, this expansion is not sustainable, and eventually leads to a contraction when credit becomes more expensive or unavailable. According to Austrian theory, the business cycle is driven by changes in the availability of credit. When credit is easy to obtain, businesses expand and invest more heavily, leading to an economic boom.
Boom and bust cycles are a natural feature of capitalism, but they can have devastating effects on workers and businesses. To mitigate the worst aspects of these cycles, the Federal Reserve was created in 1913. The Fed’s primary function is to regulate the supply of money in the economy, which can help to smooth out the ups and downs of the business cycle. For example, during an economic expansion, the Fed may raise interest rates to cool off inflationary pressures. Conversely, during a recession or credit contraction depression, the Fed may lower rates to encourage lending and investment. By using these tools, the Fed can help to minimize the destructive effects of boom-and-bust cycles.
The Austrian Business Cycle Theory has been used to explain everything from the Great Depression to the Dot-Com Bubble. Many critics argue that it does not adequately account for all the factors that can lead to a recession or depression. However, its core idea – that easy money leads to a boom-and-bust cycle – is still widely accepted.
Yesterday morning the Consumer Price Index report was released, and it showed a 9.1% annual increase in inflation. This is the highest value since 1981. Let’s look at this report in context to genuinely understand what it means to your portfolio and to the economy.
First off, are you earning 9.1% more in your job than you were a year ago?
Is your portfolio 9.1% higher than it was a year ago?
Keep in mind that 9.1% is the break-even point. Which means that you must be making 9.1% more just to tread water and break even.
In the world of investing, there is a well-known concept of compounding interest growth, referred to as the rule of 72. The rule of 72 is a straightforward way to calculate how long it will take for an investment to double, given a fixed annual rate of compound interest. To use the rule, simply divide 72 by the compound interest rate. For example, if you are earning 6% compound interest on your investment, it will take 12 years for your money to double (72 / 6 = 12). The rule of 72 is a helpful tool for measuring the growth of an investment over time, but it is important to keep in mind that it is only an estimate. For example, the actual time it takes for your money to double at 6% compound interest will be slightly less than 12 years.
In this regard let’s look at what interest rates were back in 1982 to be able to effectively contrast the different economic environments. In late 1979, inflationary pressures in the United States economy began to mount. In response, Fed Chairman Paul Volcker raised interest rates to slow down economic growth and bring inflation back under control. By 1981, the prime interest rate had reached a peak of 21.5%. The high interest rates helped to cool the economy, but they also led to a period of stagnation known as stagflation. While inflation declined, economic growth slowed sharply, and unemployment remained high. The policies of Volcker and the Fed ultimately helped to tame inflation, but they also ushered in a new era of high interest rates and slower economic growth. But the significant difference between then and now is that people could protect their purchasing power by investing in Certificates of Deposit at Banks or in the full faith and credit of the U.S. government.
In 1982 a CD was offering 14.21% with inflation at 6.1%. The result was that risk averse savers could still earn 8.11% positive yields and it would take them 8.88 years to double their money!
Compare that to the negative returns offered today:
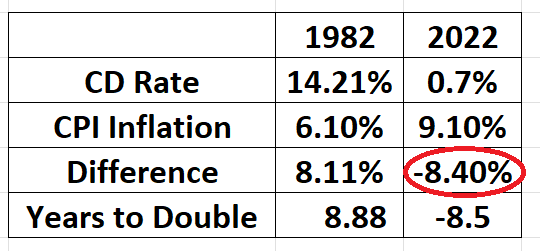
Today, a risk averse individual, trying to save money would lose 8.4% per year by trying to invest in CD’s. In 8.5 years, they would have lost more than 50% of their purchasing power.
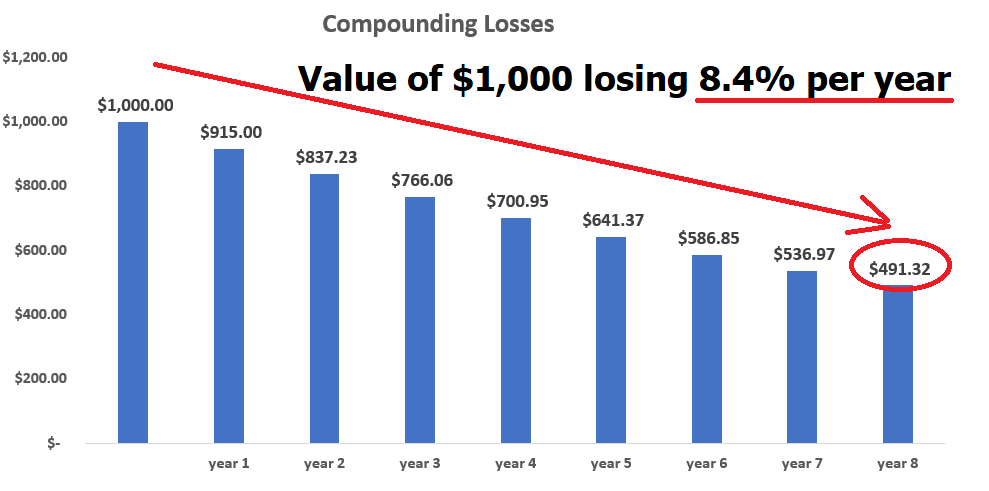
These charts and graphics represent why inflation is a hidden tax and how toxic it is for investors.
Now zoom out and look at the macro environment and you will quickly observe that there are hardly any companies which are keeping up with the inflationary pressures which all began with the easy money printing press solutions which were implemented during the economic lockdowns two years ago. Today, only 15% of all companies are trading above their 200 day moving averages! Welcome to the BUST or deleveraging part of the business cycle.
Most economists believe that boom and bust economic cycles occur every 5-10 years. However, there is no definitive answer, as the length and severity of each cycle can vary considerably. The most crucial factors are inflationary pressures and economic growth. When inflationary pressures are high and economic growth is strong, an economy is more likely to experience a boom. Conversely, when inflationary pressures are low and economic growth is sluggish, an economy is more likely to experience a bust. In between these extremes is stagflation, which occurs when inflationary pressures are high but economic growth is low. This can be a particularly difficult situation for policymakers to manage.
Austrian economists also point to the inherent contradiction within this economic logic. Whenever technology is introduced into an environment the end result is higher production at a lesser cost. Huge technological advancements have occurred in the economy since the Federal Reserve was created in 1913.
The technological advancements that have occurred in the economy over the last 100 years are truly staggering. In terms of transportation, we have gone from horses and buggies to cars and planes. In terms of communication, we have gone from telegraphs to phones to the internet. In terms of manufacturing, we have gone from production lines to robots. And in terms of medicine, we have gone from leeches to EKG’s and cat scans. Each of these technological advancements should have led to lower costs for consumers. But while the Fed has been micro-managing the economy these in large part have not occurred as the easy credit has led to a consistent and repeated debasement of the currency.
The Austrian School of economics would argue specifically that when you introduce technology into an economy that costs should exponentially decrease. When they do not, it is primarily because the unit of currency is being debased faster than the savings brought about by technology can be passed on to consumers.
In 1913, when the Federal Reserve was founded, the cost of a typical house was just over $4,000. In inflation-adjusted terms, that’s the equivalent of roughly $98,000 today. Can you find an average home anywhere in the country at that price? According to the National Association of Realtors the average price of a home in 2022 is roughly $325,000. That represents an 8,025% increase in the cost of a home.
And so, it goes.
Boom to Bust.
Bust to Boom.
If you watch the media closely there always must be somebody to blame for the times that accompany the bust.
In the 1970’s – we were doing great until Franklin National Bank went Bankrupt.
In the 1980’s we were doing great until the Latin American debt ruined everything.
In the 1990’s we were doing great until the Savings and Loan Crisis and Long-Term Capital Management ruined everything.
In the 2000’s we were doing great until the sub prime crisis and tech bubble ruined everything.
The point I am making is that the headlines in the financial media are always looking for a fall guy. We need someone to blame for the deleveraging event which is synonymous with the bust. Fill in the blank with the name of your favorite villain.
Who will it be in the 2020’s?
European Central Bank?
Vladimir Putin?
Inflationary crashes in 3rd World countries?
This is all part of the Boom-and-Bust economy managed by monetary authorities.
Central planners are those who centrally manage the economy through government regulation and intervention. They are the opposite of laissez-faire capitalists, who believe that the free market should be allowed to function without interference. Central planners often use economic growth as a justification for their policies. However, economic growth does not always mean that an economy is healthy. Just ponder the current low interest rate environment which was promoted to spur on economic growth. Today all investors are confronted with the unfortunate reality that they are ill-served to loan their money to the U.S. government and lose 8.4% per year.
During the stagflation contraction of the 1970s, economic growth continued despite high inflation and high unemployment. This led many people to believe that the economy was doing well, when it was in a depression. And since central planners often rely on currency debasement to boost economic growth, their policies can make economic problems worse over time. This is what Ludwig von Mises meant when he said that central planners were trying to put out a fire by pouring gasoline on it.
It is these economic policies that investors and traders need to question, particularly when economic problems tend to get worse instead of better.
How do you go about making sense of it all?
Central to all of this is the challenge of trying to maintain the purchasing power of the hard-earned monies in your portfolio.
Even in the best of economic environments, finding trading opportunities can be a challenge. But in a horrific economic environment like we’re currently experiencing, it can feel impossible. However, there are still ways to find good trading opportunities, you just must know where to look. One way to find good trading opportunities is to look for loss of purchasing power. This happens when the value of a currency debases, or contracts. This can happen during an economic recession or depression, and often leads to commodities becoming undervalued. Another way to find good trading opportunities is to look for companies that are still expanding despite the contraction of the economy. These companies are usually essential, meaning they provide goods or services that people need regardless of the state of the economy.
The purpose of artificial intelligence is to locate these trends and to keep you on the right side of them at the right time.
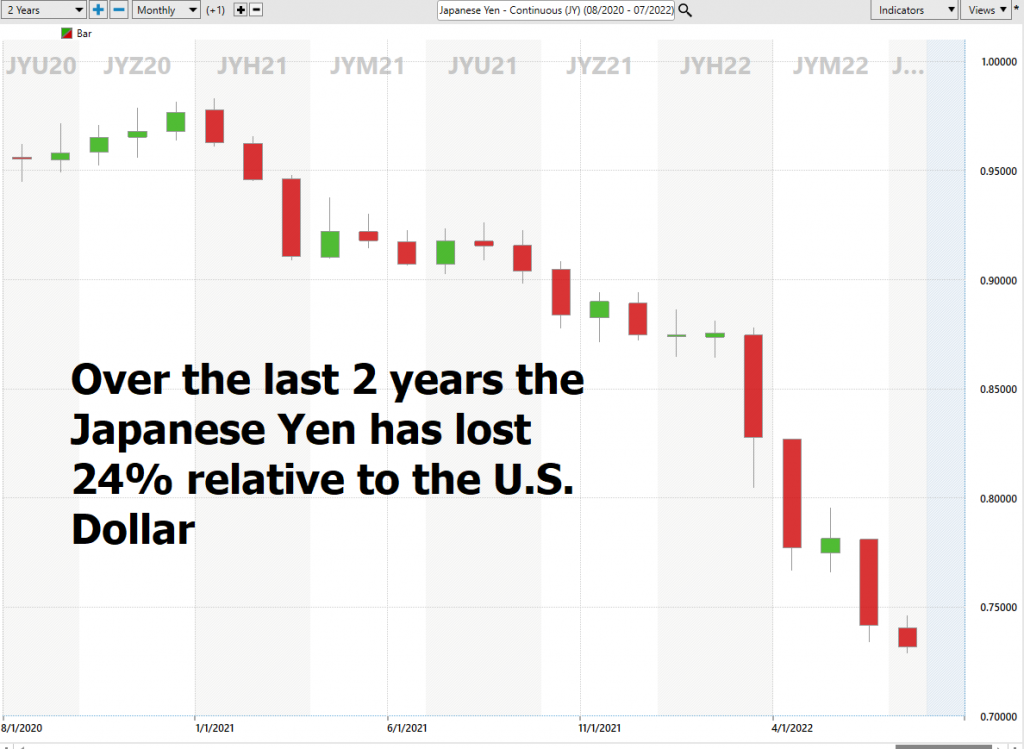
If you think the currency debasement in the United States is bad all you need to do is compare it to the G8 nations which are being devalued even faster.
Here is a chart of the Yen. Japan has the highest Debt to GDP ratio of any nation in the world.
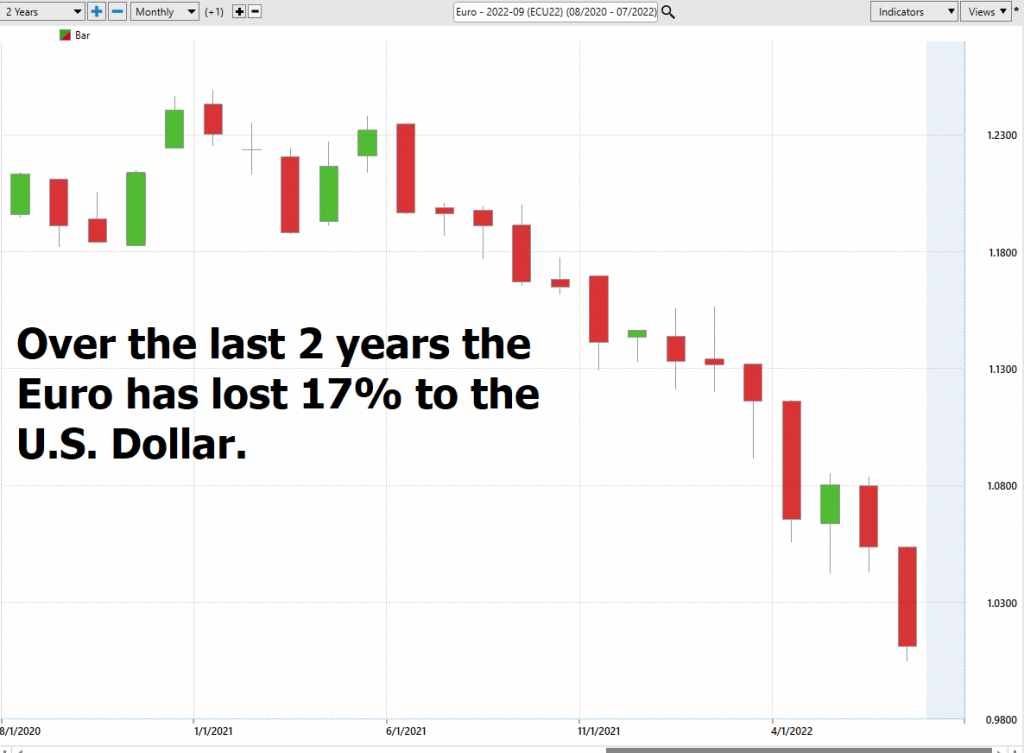
Here is the Euro. Interest rates in Europe have been negative for 8 years.
Here is the British Pound.
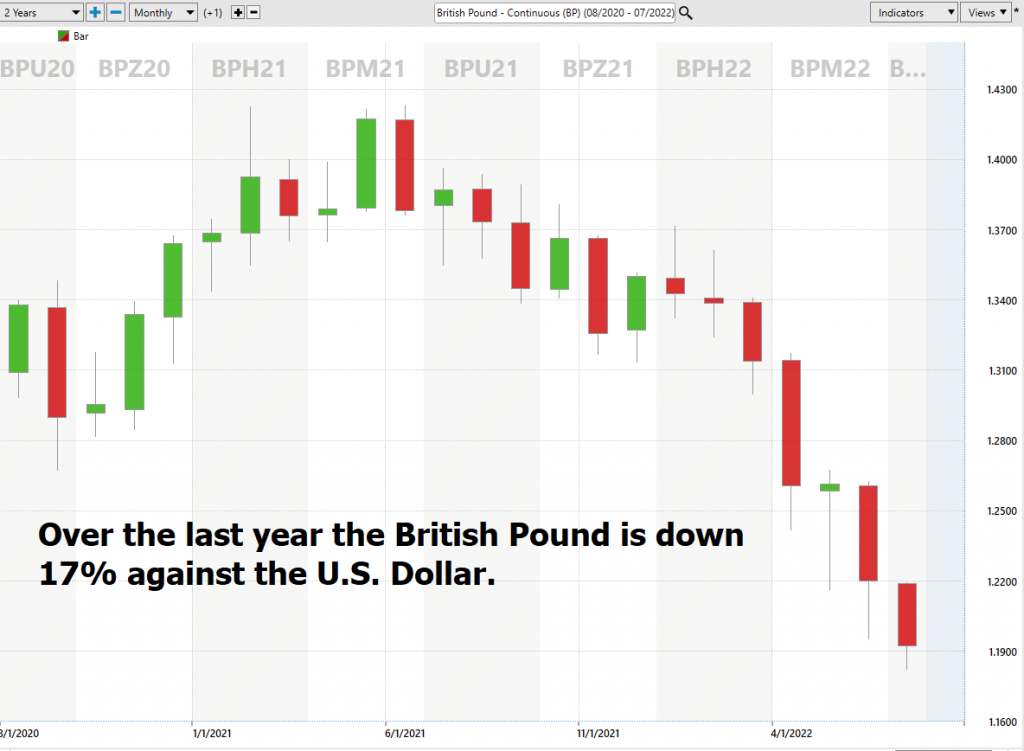
But today the strong dollar is not a sign of a healthy economy. Money is rushing into the dollar because other fiat currencies have even more serious problems than the U.S. currency. Stop and think about how citizens in those countries must try and cope with higher food and gasoline prices based upon their debased currency.
Regardless how we all may try to spin it, it’s ugly out there.
But all this currency debasement spells crisis or opportunity. It is up to you.
Using artificial intelligence, machine learning, neural networks and intermarket analysis is how we turn this nasty economic environment into an opportunity to maintain or increase our purchasing power.
From the perspective of the public, the Fed, and the administration, a 9.1% CPI report is horrible news. For lower- and medium-income regular people—9.1 percent price inflation means declining real wages, because employers’ earnings can’t keep up with rising inflationary prices.
But for traders this volatility is a dream come true and a chance to escape the toxic effects of currency debasement which are happening all over the world.
This is why neural networks, machine learning, and artificial intelligence are a necessity for today’s trader. When what “SHOULD” happen aligns with what “IS” happening some pretty explosive outcomes can occur and that is where you want to be as a trader. That is the promise of a.i. can make to you today.
The challenge of trading is the organization of information so that effective decision-making can occur. How good have your decisions been over the past year? How do you think your trading decisions compare to a.i.? Mistakes are problematic for humans but for machine learning, it is the pathway to mastery and excellence. The real education in trading always lies in learning from the losers and completely understanding why something doesn’t work. More importantly, as a trader you want to focus your hard-earned savings on what is proven to work.
The Vantagepoint A.I. forecasts are up to 87.4% accurate, one to three days in advance.
Most humans have a really tough time learning from bad experiences. The ego gets in the way, each and every time.
Since artificial intelligence has beaten humans in Poker, Chess, Jeopardy and Go! do you really think trading is any different?
Let’s be careful out there.
We will continue to see tremendous volatility based upon these huge forces at work. Manage your risk or it will manage you.
Visit with us and check out the A.I. at our Next Live Training.
It’s not magic. It’s machine learning.
Make it count.

IMPORTANT NOTICE!
THERE IS SUBSTANTIAL RISK OF LOSS ASSOCIATED WITH TRADING. ONLY RISK CAPITAL SHOULD BE USED TO TRADE. TRADING STOCKS, FUTURES, OPTIONS, FOREX, AND ETFs IS NOT SUITABLE FOR EVERYONE.
DISCLAIMER: STOCKS, FUTURES, OPTIONS, ETFs AND CURRENCY TRADING ALL HAVE LARGE POTENTIAL REWARDS, BUT THEY ALSO HAVE LARGE POTENTIAL RISK. YOU MUST BE AWARE OF THE RISKS AND BE WILLING TO ACCEPT THEM IN ORDER TO INVEST IN THESE MARKETS. DON’T TRADE WITH MONEY YOU CAN’T AFFORD TO LOSE. THIS ARTICLE AND WEBSITE IS NEITHER A SOLICITATION NOR AN OFFER TO BUY/SELL FUTURES, OPTIONS, STOCKS, OR CURRENCIES. NO REPRESENTATION IS BEING MADE THAT ANY ACCOUNT WILL OR IS LIKELY TO ACHIEVE PROFITS OR LOSSES SIMILAR TO THOSE DISCUSSED ON THIS ARTICLE OR WEBSITE. THE PAST PERFORMANCE OF ANY TRADING SYSTEM OR METHODOLOGY IS NOT NECESSARILY INDICATIVE OF FUTURE RESULTS. CFTC RULE 4.41 – HYPOTHETICAL OR SIMULATED PERFORMANCE RESULTS HAVE CERTAIN LIMITATIONS. UNLIKE AN ACTUAL PERFORMANCE RECORD, SIMULATED RESULTS DO NOT REPRESENT ACTUAL TRADING. ALSO, SINCE THE TRADES HAVE NOT BEEN EXECUTED, THE RESULTS MAY HAVE UNDER-OR-OVER COMPENSATED FOR THE IMPACT, IF ANY, OF CERTAIN MARKET FACTORS, SUCH AS LACK OF LIQUIDITY. SIMULATED TRADING PROGRAMS IN GENERAL ARE ALSO SUBJECT TO THE FACT THAT THEY ARE DESIGNED WITH THE BENEFIT OF HINDSIGHT. NO REPRESENTATION IS BEING MADE THAT ANY ACCOUNT WILL OR IS LIKELY TO ACHIEVE PROFIT OR LOSSES SIMILAR TO THOSE SHOWN.

