
| Country Healthcare is a healthcare staffing company that provides a broad range of healthcare staffing services. These include temporary and permanent placement of healthcare professionals in a variety of settings, such as hospitals, clinics, and physician offices. The company also provides management and consulting services to healthcare organizations. In addition, Cross Country Healthcare operates several healthcare facilities across the United States. These facilities provide a range of services, including skilled nursing care, assisted living, and home health care. Cross Country Healthcare has a market cap of 938.72 million. The company is considered a small cap company and trades on average 469,106 shares a day. They have over 8,000 employees and are one of the leading providers of temporary healthcare staffing in the United States. Their competitors include AMN Healthcare and Healthtrust Workforce Solutions. Cross Country Healthcare has a long history dating back to 1984. They are headquartered in Boca Raton, Florida and have offices across the country. They offer a variety of services including temporary staffing, permanent placement, physician recruiting, and more.
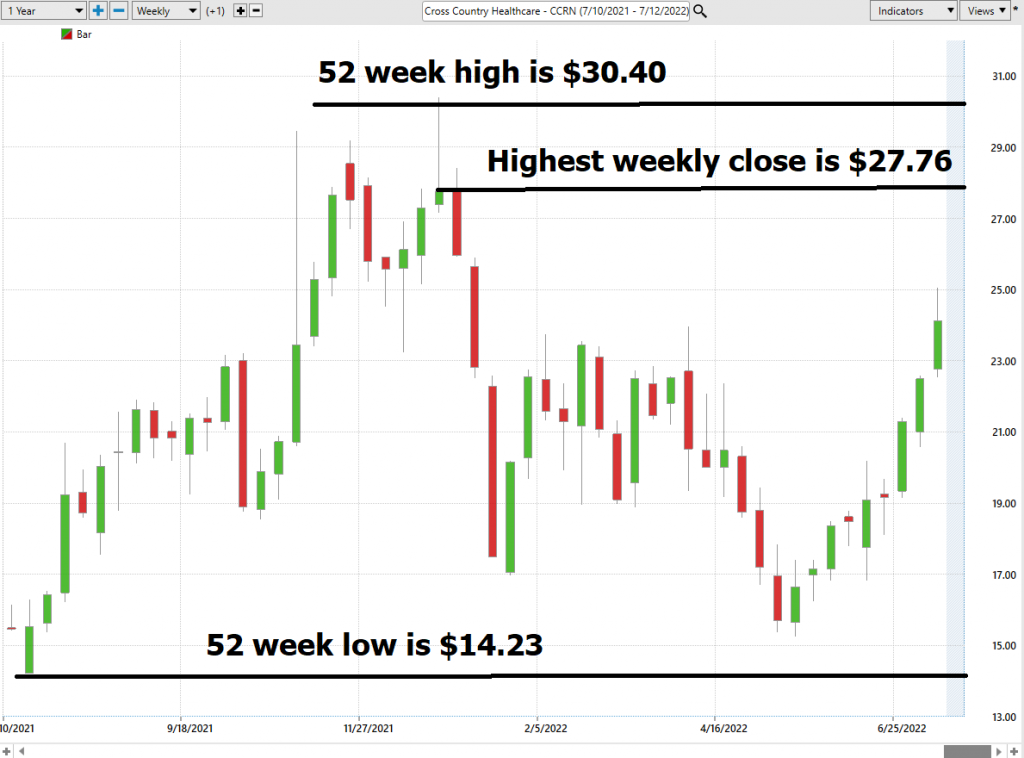
In this weekly stock study, we will look at and analyze the following indicators and metrics which are the guidelines which dictate our behavior regarding a particular stock. 1) Wall CrossStreet Analysts’ Estimates 2) 52-week high and low boundaries Wall Street Analysts’ Estimates Based on 2 Best Performing Wall Street analysts offering 12-month price targets for Cross Country Healthcare in the last 3 months. The average price target is $35.00 with a high forecast of $44.00 and a low forecast of $26.00. The average price target represents a 43.91% change from the last price of $24.32. Since $CCRN is a small cap company only two analysts track the stock. Be forewarned, despite their very optimistic outlook we need to dig deeper to evaluate genuine risk and reward opportunities. Small cap companies can offer unique trading opportunities. However, the problem with small caps is the very thin volume often leads to wide spreads between the bid and the offer prices. Also, one institution can move the market substantially. It is worth putting a stock like this on your radar just to watch and observe how it responds to the macroeconomic news environment. 52-Week High and Low Boundaries Over the past 52 weeks $CCRN has traded as high as $30.40 and as low as $14.23. The annual trading range was $16.17. This equates to an average weekly trading range of $.31 or stated in another way the average weekly trading range is 1.28% of the closing price. $CCRN is currently trading at its 61st percentile for the year. When we look at the 52-week chart we can observe that it encountered tremendous selling pressure as it made new 52-week highs. Its highest weekly close has been $27.76. |
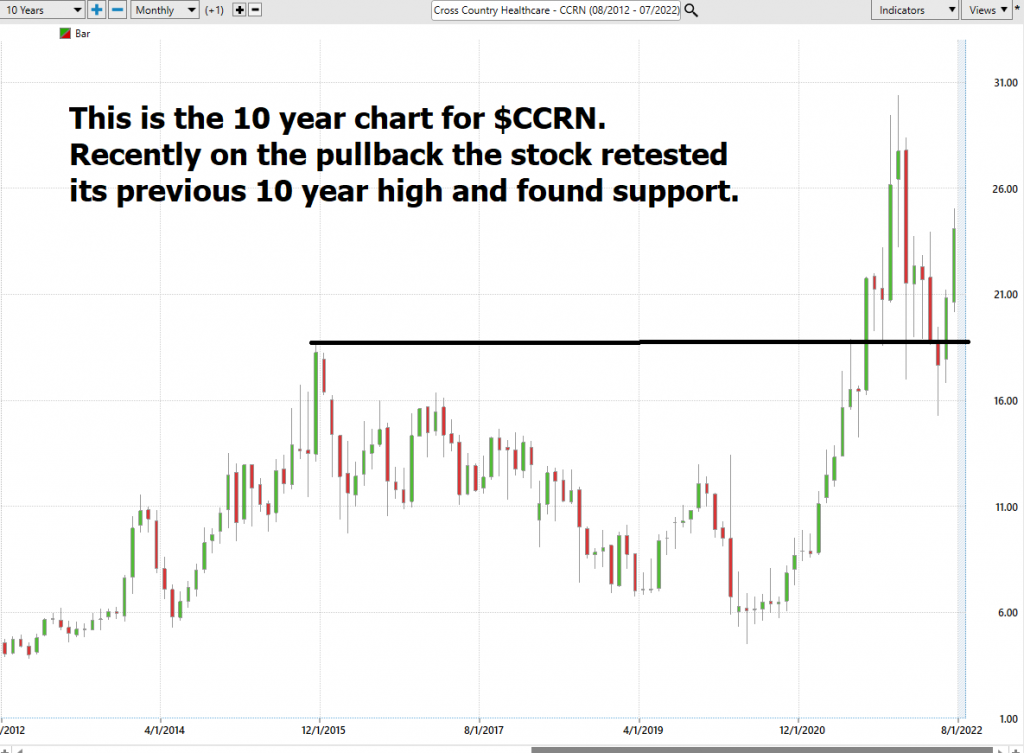
We also like to look at an asset in terms of its 10-year time frame.
What we find incredibly useful and practical is to be very aware of the trading ranges for the weekly, monthly and quarterly time frames. The trading ranges for those time frames provide excellent volatility benchmarks that traders can use to know what the market has offered during that period.
A good rule of thumb is that if a stock is offering you X amount over a given time frame, a good trader should target 40% to 50% of that amount. A common mistake that many traders make is they target more than the market is offering and stay in a position far too long.
Over the last 10 years the average monthly trading range has been 21.9% of the closing price.
Over the last 10 years the average weekly trading range has been roughly 10% of the closing price.
These values and the previous charts provide a very realistic expectation of the volatility of this asset.
Next, we compare $CCRN with the broader stock market indexes to evaluate risk versus reward.
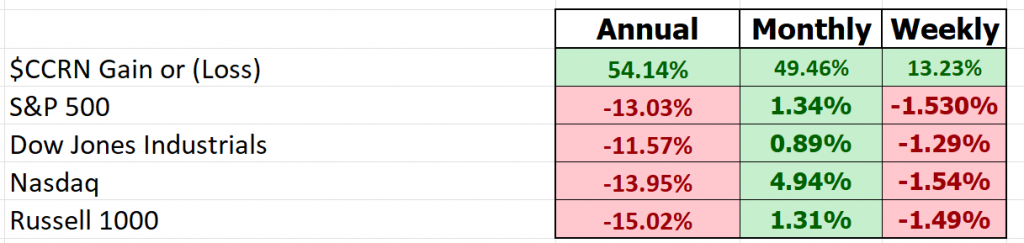
We can conclude that $CCRN has performed much better than the broader market over the last week, month, and year. Undoubtedly, while the broader market has suffered investors have been looking for something that has not suffered to the extent of the Stock indexes.
Best Case – Worst Case Scenario
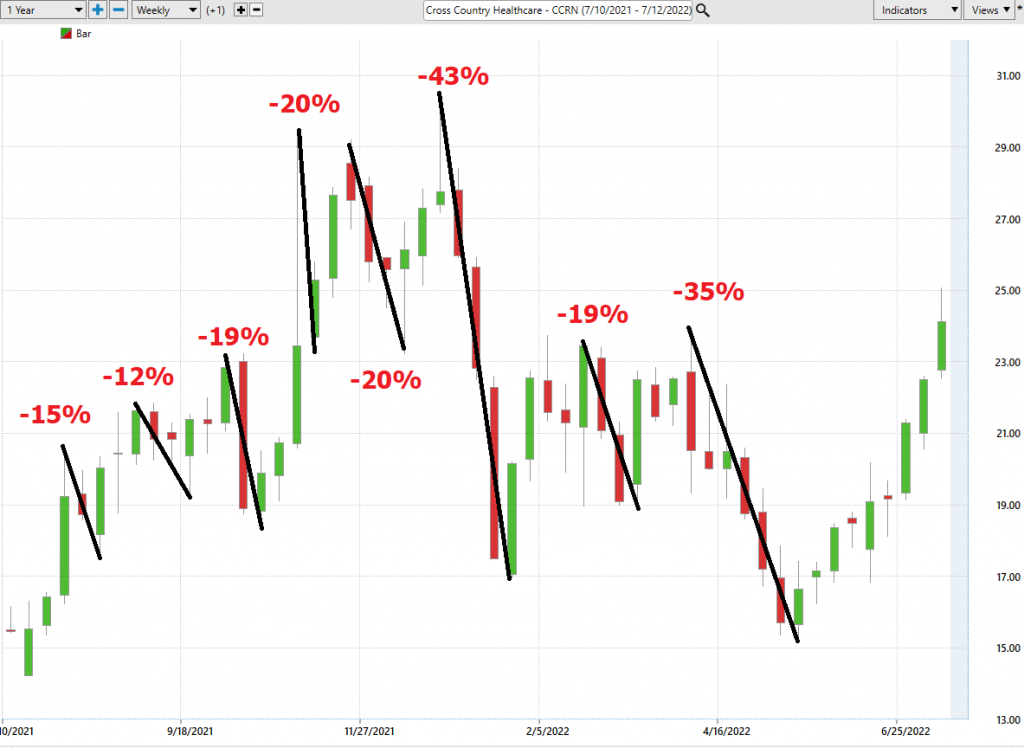
But we also want to get an idea of the best case and worst-case scenarios have been in the asset. We refer to this as the best case versus worst case analysis.
To get an idea of the risk and reward we simply mark on the chart any rally and decline of 10% or greater. These values are the ranges between the low and the high price.
The following charts are helpful in distilling and defining the volatility of this asset.
Here is the worst-case analysis:
Here is the best-case analysis:
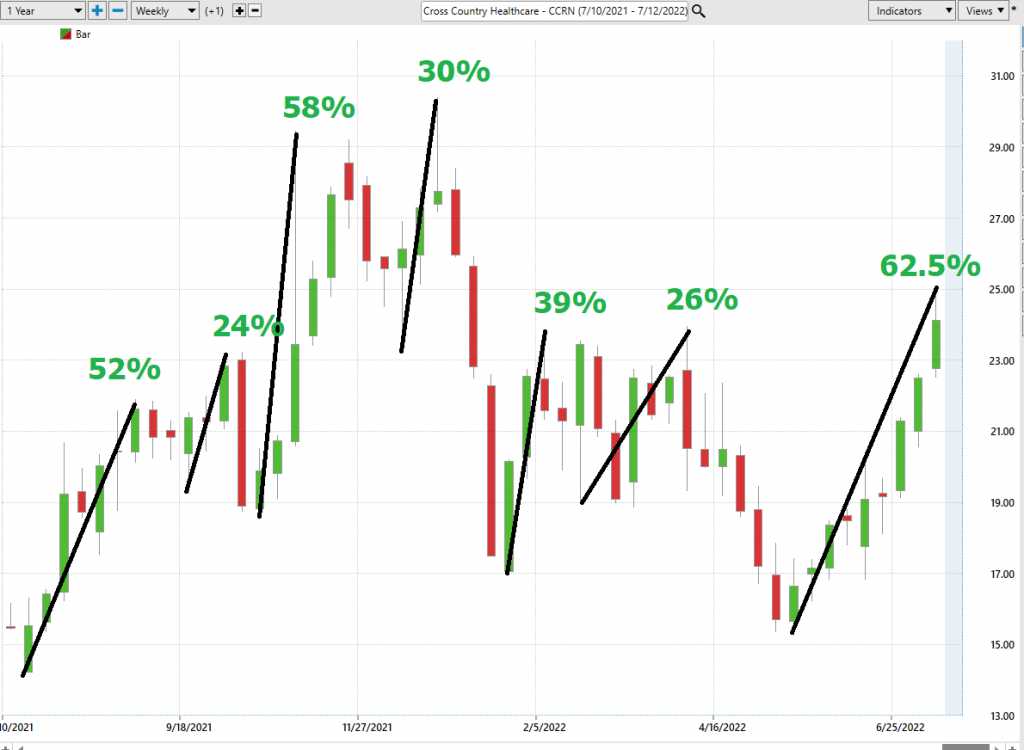
Viewed from this perspective we can see that $CCRN has been a hit and run volatility sandwich.
The software focuses on the daily price action. You’ll see that there’s a black line and also a blue line right up against the price data on the chart.
The predictive blue line also acts as value zone where in uptrends traders try to purchase the asset at or below the blue line.
In studying the $CCRN chart above pay close attention to the relationship between the black line and predictive blue line. All that the black line tells you is what has occurred. It tells you where prices have been and what the average price over the last ten days has been. Your challenge now is to try and fine tune your entries so you can try to purchase at or below the predictive blue line in an uptrend.
The predictive blue line utilizes that Vantagepoint patented Neural Network and Intermarket Analysis to arrive at its value. It looks at the strongest price drivers of an asset through artificial intelligence and statistical correlations to make a statistically sound trend forecast.
Power traders use the predictive blue line in helping to determine both the value zone as well as the trend direction.
The black line that you see that is a regular simple 10 period moving average. A very common technical indicator. And it’s a good measure to go ahead and smooth out the price data and it gives us an indication of where market prices have been over a given period of time. But obviously as traders we really need to understand is where our market price is moving going forward.
So, what we want to do is compare that black line value on the chart to the predictive blue line, which is Vantagepoint’s predictive indicator. What it does is Vantagepoint is utilizing its technology to perform what’s called intermarket analysis. So that means that there’s known relationships as far as those neural networks are concerned that affect and drive the future price of Waste Management. That’s going to be things like the S&P 500 or the Russell 2000 or the NASDAQ. That’s going to be things like global currencies or global interest rates, or futures and commodity markets.
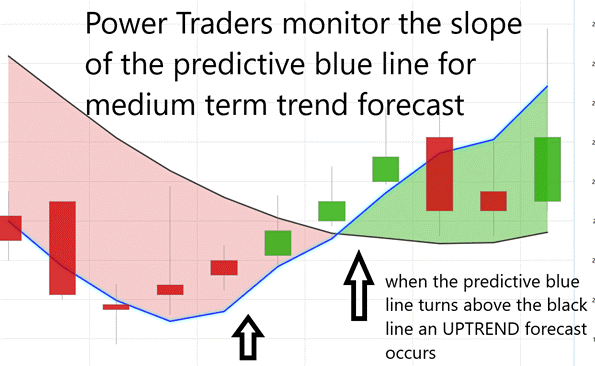
Here is a chart of just the predictive blue line accompanied by the simple 10 day moving average – the black line.
Observe how the SLOPE of the predictive blue line anticipates the future trend. We refer to this as the predictive moving average which incorporates machine learning, intermarket analysis and advanced pattern recognition to arrive at its daily value.
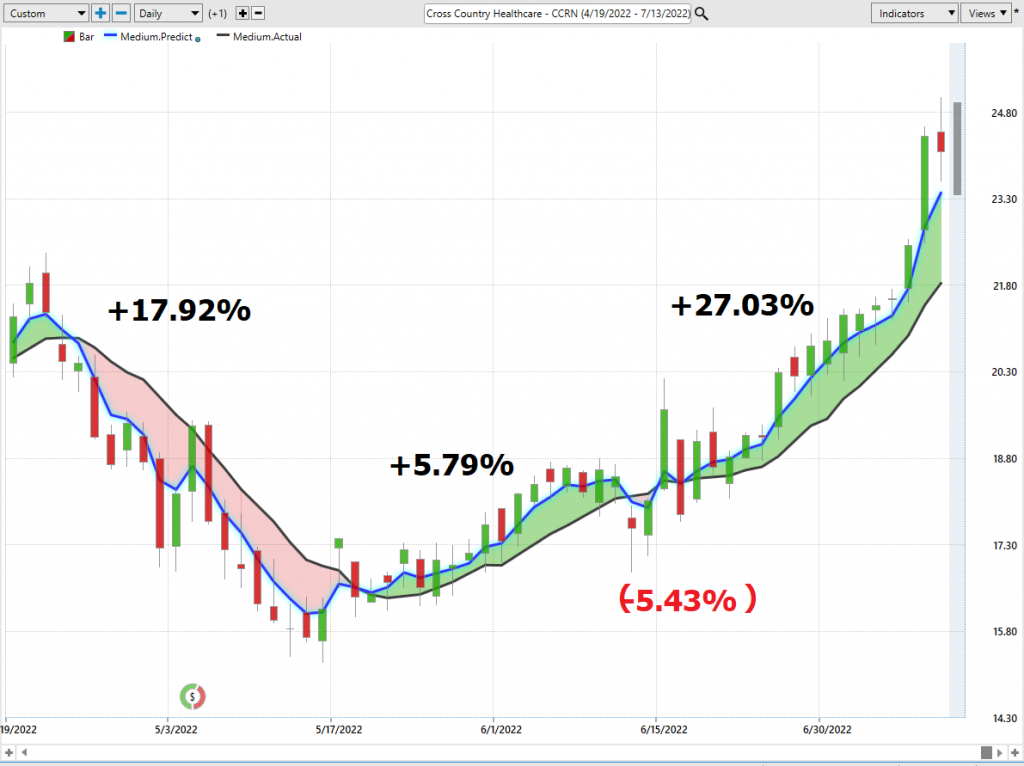
In the last three months there were four trading opportunities.
#1 was a winner on the short side for 17.92%
#2 was a winner on the long side for 5.79%
#3 was a loser on the short side for 5.43%
#4 was a winner on the long side for 27.03%
Neural Network Indicator (Machine Learning)
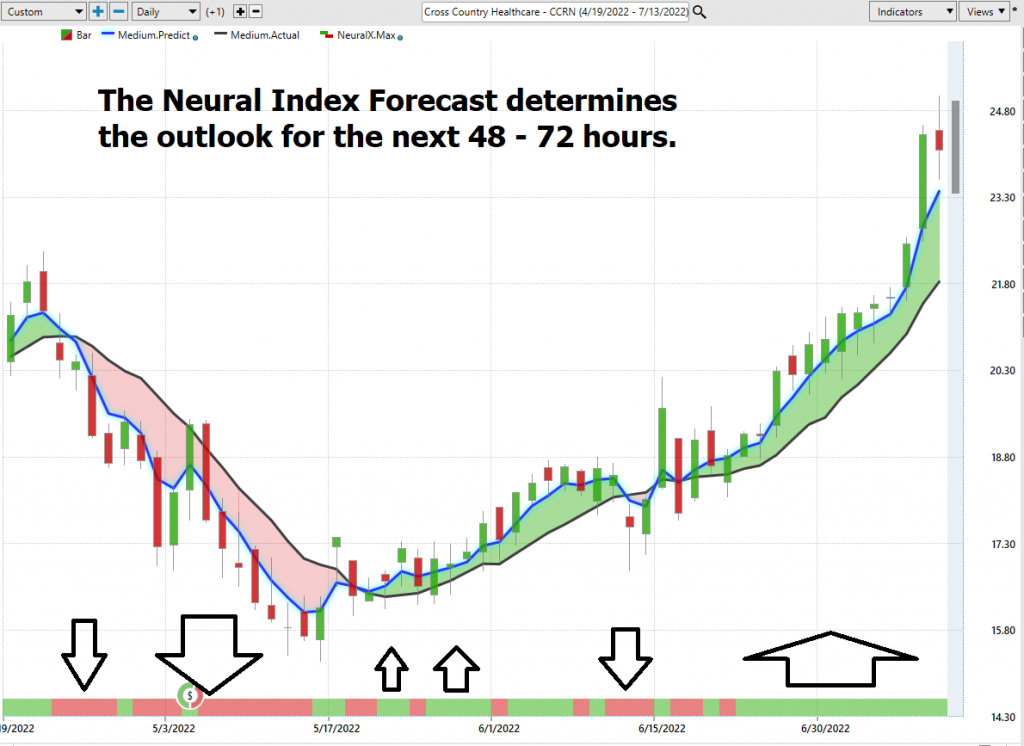
At the bottom of the chart is the Neural Network Indicator which predicts future short-term strength and/or weakness in the market. When the Neural Net Indicator is green it communicates strength. When the Neural Net is red it is forecasting short term weakness in the market. The Neural Index forecast is for the next 48 to 72 hours.
A neural network is a computing system that is modeled after the brain. neural networks are composed of input nodes, output nodes, and hidden nodes. Input nodes receive information from the outside world, while output nodes send information to the outside world. Hidden nodes are neither input nor output nodes; rather, they process information internally. neural networks learn by adjusting the weights of the connections between the nodes. The stronger the connection between two nodes, the more influential that connection is. neural networks can be used for a variety of tasks, including pattern recognition and data classification.
At its essence, a Neural Net is a computational learning system that uses a network of functions to understand and translate massive amounts of data into a desired output, consistently monitoring itself and improving its performance.
Whenever Power Traders are looking for statistically valid trading setups, they look for a DOUBLE confirmation signal. This signal occurs whenever the blue predictive line and the Neural Net at the bottom of the chart suggest the same future expected outcome. The arrows on the following chart isolate the double confirmation setup.
Neural networks are quantitative and probabilistic, meaning they can take historical data and output a probability distribution for future outcomes. This makes them well suited for trading the financial markets, as they can identify patterns that human traders miss. For example, neural networks can recognize patterns in price data that show a trend is about to reverse. By using neural networks, traders can gain an edge over their rivals and make more informed decisions about when to buy and sell.
We advocate that Power Traders cross reference the $CCRN chart with the predictive blue line and neural network indicator to create optimal entry and exit points.
Power Traders are always looking to apply both the neural network and a.i. to the markets to find statistically sound trading opportunities
VantagePoint Software Daily Price Range Prediction
One of the powerful features in the VantagePoint Software which Power Traders use daily is the Price Range prediction forecast.
This forecast is what allows Power Traders to truly fine tune their entries and exits into the market.
Every day traders are faced with the anxiety and frustration of wondering where they should be looking for opportunities to buy and sell the market. VantagePoint’s A.I. makes this decision super easy with the Daily Price Range Forecast. This is where the rubber meets the road.
This is some serious volatility. Here is the price chart of $CCRN during the most recent uptrend. The software very clearly delineates the daily forecast by providing an exact lower and upper boundary and delineates the trend.
$CCRN is a volatility sandwich. Trading an asset like $CCRN requires a tool that can effectively forecast these volatile moves.
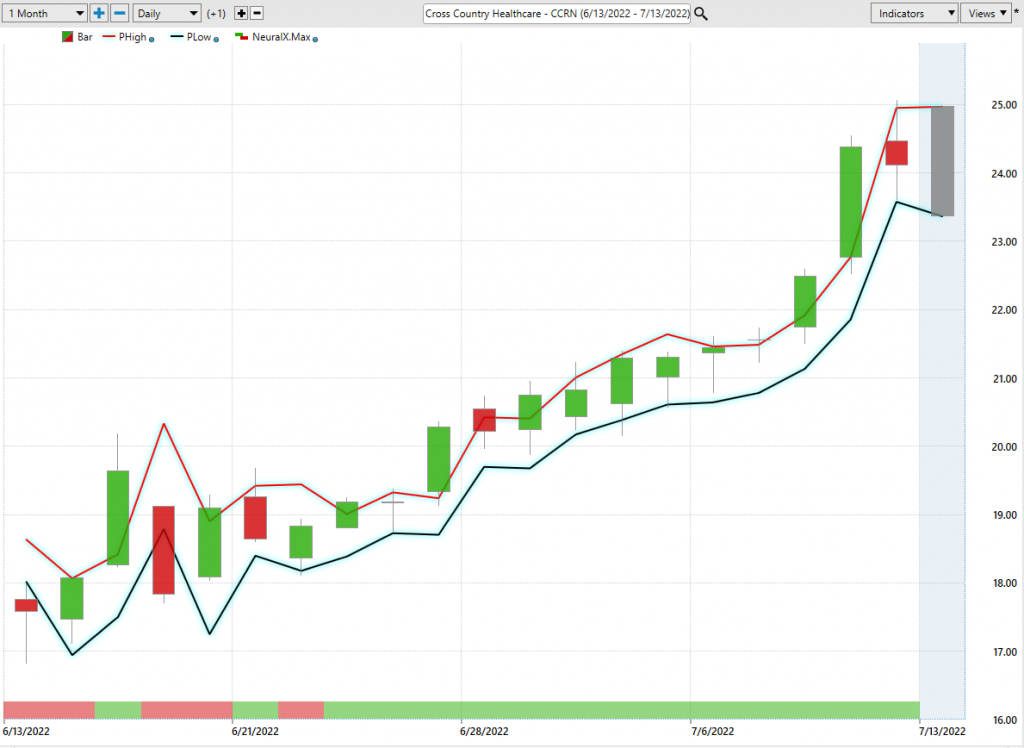
In spite of its massive volatility the daily range forecast provides very precise navigation with exacting precision.
Power Traders try to use a price level below the predictive low price to place their protective sell stops in the market in case a sudden reversal was to occur. Observe how the predictive price low also provided numerous short term entry opportunities for traders to buy $CCRN as it was trending higher.
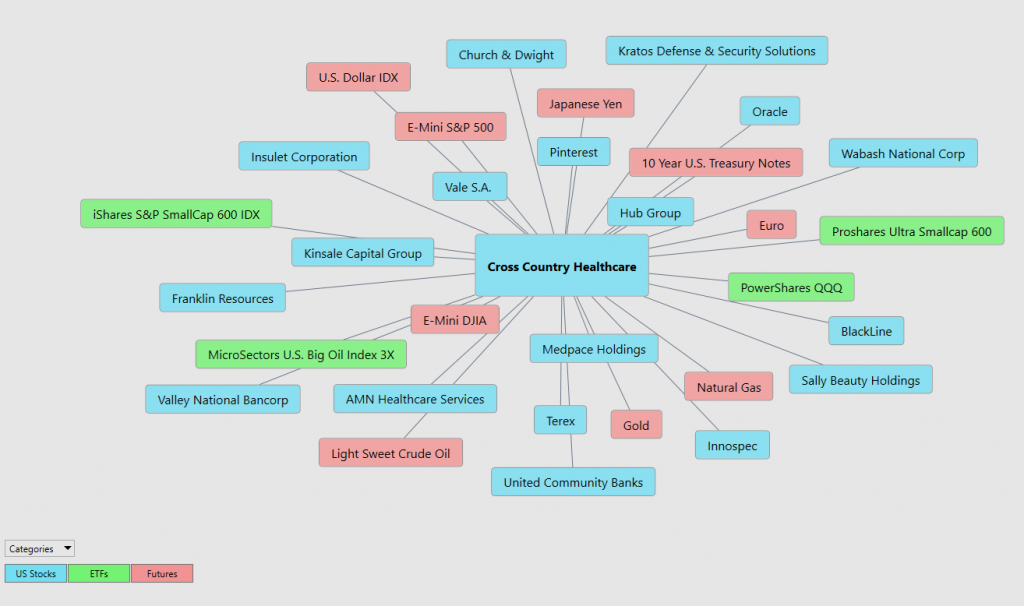
Intermarket Analysis
What makes Vantagepoint unique and distinct when compared to all other analytical tools is its patented and proprietary intermarket analysis.
Intermarket analysis is a method of analyzing markets by examining the correlations between different asset classes. In other words, what happens in one market could, and probably does, affect other markets, so a study of the relationship(s) is often very helpful to a trader.
Studying the charts can always provide objective realities in terms of locating support and resistance levels which become very clear on a chart. But we live in a global marketplace. Everything is interconnected. The billion-dollar question for traders is always what are the key drivers of price for the underlying asset that I am trading?
These intangibles are invisible to the naked eye yet are responsible for driving prices. These markets show very high statistical correlations. Looking at studying the intermarket analysis will uncover competitors as well as other sectors which are often poised to trend like the asset you are studying.
Instead of looking at financial markets or asset classes on an individual basis, intermarket analysis looks at several strongly correlated markets, or asset classes, such as other stocks, currencies, ETFs, and commodities. This type of analysis expands on simply looking at each individual market or asset in isolation by also looking at other markets or assets that have a strong relationship to the market or asset being considered. The Vantagepoint software analyzes the top 31 drivers of an assets price. This analysis will often show ETF’s which are big owners of the underlying asset, but it will also uncover other markets which are statistically correlated to the trend you are analyzing. Traders often find other blossoming opportunities when engaging in Intermarket Analysis.
There is great value to be had in studying and understanding the key drivers of $CCRN price action.
Intermarket analysis is the study of different asset classes in order to identify correlation and show key price drivers. When correlation exists between two asset classes, they tend to move in the same direction. By identifying correlation, traders can make decisions about which asset class is likely to outperform or underperform based on key drivers. The biggest investors in the financial markets are central banks, commercial banks, institutional investors, and hedge funds. Each of these investor types has a different investment time horizon and risk appetite, which drives their investment decisions. Often times intermarket analysis allows you to see which ETFs are buying up an asset. Awareness of this reality can provide traders a giant leg up in their trading.
Our Suggestion
Anyone who wants to be a successful trader needs to have a clear understanding of risk and reward. Every trade carries the potential for both profit and loss, and it’s important to have a realistic view of both the best- and worst-case scenarios. By taking the time to assess the big picture, traders can set realistic expectations and avoid making decisions based on emotions. Of course, no one can predict the future with 100% accuracy, but by analyzing the risk and reward potential of each trade, traders can give themselves a better chance of coming out ahead in the long run.
$CCRN is a small cap stock that has outperformed the broader stock market indexes over the past week, month and year. However, as a small cap stock which only trades on average 469,000 shares per day, $CCRN is prone to wild, volatile moves. Only seasoned traders with good money management skills should venture into trading this asset.
Even the best-performing assets have risks and we need to trade them with realistic expectations.
All great traders have one thing in common: they practice good money management. Money management is how you control how little you lose when you are wrong and how much you make when you are right. Good money management keeps your losses small and manageable so that your profits can run. It also means having realistic trading expectations. Many novice traders think that they need to make a large profit on every trade in order to be successful, but this is simply not the case. In fact, most professional traders only aim for a small profit on each trade, but they make sure to keep their losses small as well. By following these simple money management principles, you can put yourself on the path to becoming a successful trader.
We think $CCRN deserves to be on your trading radar. However, it is a very speculative trade.
Let’s Be Careful Out There!
Remember, It’s Not Magic.
It’s Machine Learning.

IMPORTANT NOTICE!
THERE IS SUBSTANTIAL RISK OF LOSS ASSOCIATED WITH TRADING. ONLY RISK CAPITAL SHOULD BE USED TO TRADE. TRADING STOCKS, FUTURES, OPTIONS, FOREX, AND ETFs IS NOT SUITABLE FOR EVERYONE.
DISCLAIMER: STOCKS, FUTURES, OPTIONS, ETFs AND CURRENCY TRADING ALL HAVE LARGE POTENTIAL REWARDS, BUT THEY ALSO HAVE LARGE POTENTIAL RISK. YOU MUST BE AWARE OF THE RISKS AND BE WILLING TO ACCEPT THEM IN ORDER TO INVEST IN THESE MARKETS. DON’T TRADE WITH MONEY YOU CAN’T AFFORD TO LOSE. THIS ARTICLE AND WEBSITE IS NEITHER A SOLICITATION NOR AN OFFER TO BUY/SELL FUTURES, OPTIONS, STOCKS, OR CURRENCIES. NO REPRESENTATION IS BEING MADE THAT ANY ACCOUNT WILL OR IS LIKELY TO ACHIEVE PROFITS OR LOSSES SIMILAR TO THOSE DISCUSSED ON THIS ARTICLE OR WEBSITE. THE PAST PERFORMANCE OF ANY TRADING SYSTEM OR METHODOLOGY IS NOT NECESSARILY INDICATIVE OF FUTURE RESULTS. CFTC RULE 4.41 – HYPOTHETICAL OR SIMULATED PERFORMANCE RESULTS HAVE CERTAIN LIMITATIONS. UNLIKE AN ACTUAL PERFORMANCE RECORD, SIMULATED RESULTS DO NOT REPRESENT ACTUAL TRADING. ALSO, SINCE THE TRADES HAVE NOT BEEN EXECUTED, THE RESULTS MAY HAVE UNDER-OR-OVER COMPENSATED FOR THE IMPACT, IF ANY, OF CERTAIN MARKET FACTORS, SUCH AS LACK OF LIQUIDITY. SIMULATED TRADING PROGRAMS IN GENERAL ARE ALSO SUBJECT TO THE FACT THAT THEY ARE DESIGNED WITH THE BENEFIT OF HINDSIGHT. NO REPRESENTATION IS BEING MADE THAT ANY ACCOUNT WILL OR IS LIKELY TO ACHIEVE PROFIT OR LOSSES SIMILAR TO THOSE SHOWN.

