

Commodities have been getting killed in 2013, and it seems there haven’t been many survivors, especially this month. The PowerShares Multi-Sector Commodity ETF ($DBA) hasn’t seen a positive day in the entire month of February, 11 red candles that resemble a waterfall – dropping straight down.
INTERESTING SET-UP
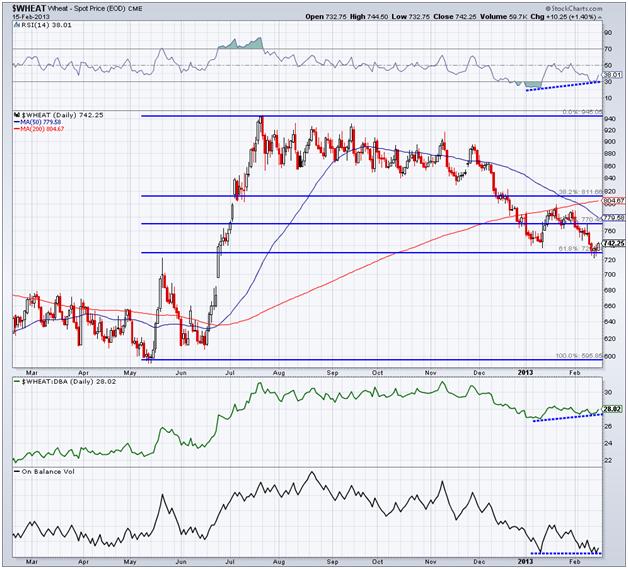
Wheat however is creating an interesting technical setup, with signs of support, positive divergences, and a group of traders breaking from their trend and getting net-long. Like the sector as a whole, wheat topped out last summer and has not participated in the multi-month ‘risk on’ rally we’ve seen in equities and junk debt. Looking at last week we can see that price was unable to close below the 61.8% Fibonacci retracement level from the May ’12 low to the July ’12 high. Even though wheat has not been rising over the last two months, it has been outperforming its overall sector based on the $DBA ETF as we can see with the green line in the third panel of the chart. This line is the relative performance of spot wheat prices compared to $DBA. When the line is rising we know that wheat is going up more or going down less than $DBA.
BULLISH DIVERGENCE
When looking at momentum we can see that spot wheat prices saw weakness in February as it broke below the previous low in January of $740, but momentum (based on the RSI indicator) created a positive divergence, a good sign for bulls. In the bottom panel of the chart below we have On Balance Volume (OBV); all this indicator does is simply add and subtracts the number of shares traded from each day depending on whether it was a positive or negative day. We can use this data to roughly see if there is more selling vs. buying based on the amount of trading activity happening on weakness (down days) compared to strength (up days). OBV is currently showing us that buyers are stepping in by not making a new low alongside price.
KANSAS CLUES
Finally, we have a shift taking place in the Kansas City wheat market. Based on the latest COT data, the commercial (‘smart money’) traders currently have, although very small, a net-long position in KC wheat. This doesn’t happen very often as commercial traders are normally short wheat as a hedge to the wheat in other areas of their portfolio or business. Since 2010 we’ve seen commercial traders get net-long two other instances. In early 2010 when wheat was creating a bottom before rising $400, and most recently in mid-2012 before the commodity rose $350. I’ll be watching to see if they continue to add to this net-long position this week (data will be released on Thursday) or if they turn back around and exit the long trades created last week.
Disclaimer: The information contained in this article should not be construed as investment advice, research, or an offer to buy or sell securities. Everything written here is meant for educational and entertainment purposes only. I or my affiliates may hold positions in securities mentioned.
= = =

