Advertisement
Education

Jesse Livermore’s Pivotal Point: Ugly Duckling Buy Set-up

Jesse Livermore’s Pivotal Point: Ugly Duckling Buy Set-up

In last month’s column I discussed the rise of what I call the “Ugly Duckling” buy set-up where we seek to buy a stock not as it makes news highs, but instead as it begins to round out the lows of a potential new chart base or consolidation.

I also showed examples of stocks like Lannett Company (LCI) and CyberArk Software (CYBR) which had strong moves coming off the lows of pullbacks and then started up the right side of what eventually turned out to be a new base formation. These buy set-ups led to significant upside profits, as the daily chart of LCI in Chart 1, below, shows. The stock had several buy signals along the lows of the pattern before moving rapidly up the right side of a new “cup” base. However, once LCI broke out to new highs, its ensuing price move became quite volatile and eventually gave way to the downside. Thus the best move in the stock came up and off of the lows with several Ugly Duckling buy set-ups along the way.
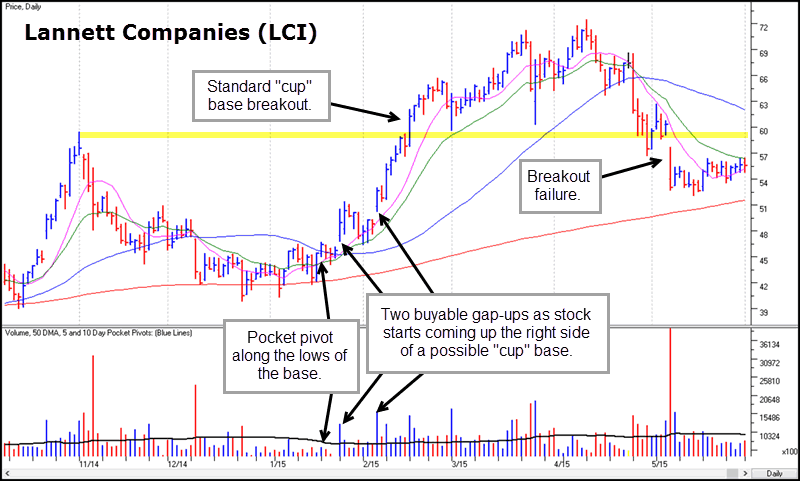
 

Chart_1_-_LCI_Daily.gif

Chart 1 – Lannett Company (LCI) daily chart. Chart courtesy of HGS Investor Software, LLC, ©2015, used by permission.

Since many have been indoctrinated into the false idea that only base breakouts can be bought, some might find this Ugly Duckling concept to be somewhat radical. However, the truth is that the Ugly Duckling is firmly rooted in the investment methods and philosophy of the great trader, Jesse Livermore, the “hero” of the investment classic Reminiscences of a Stock Operator, by Edwin Lefevre. In fact, Livermore describes what he calls a “pivotal point” in Chapter 5 of the only book he ever wrote, How to Trade in Stocks, first published by Duell, Sloan & Pierce in 1940. This is not to be confused with a “pivot point,” which is the term that William J.  O’Neil adapted from Livermore’s “pivotal point” to describe a simple new-high base breakout.

As I see it, Jesse Livermore’s idea of a “pivotal point” meant far more than just a simple Technical Analysis 101 base breakout to new highs. In fact, Livermore considered a breakout to new highs to be a “late” buy point. As he is quoted in the updated edition of “How to Trade in Stocks” put out by Richard Smitten in 2006 (John Wiley & Sons), “The final time a trader can pyramid is when a stock breaks out to a clear new high on HEAVY VOLUME; this is a very good sign because it most likely means that there is no more overhanging stock to stop the progress of the stock for a while.” Instead, Livermore’s pivotal point had a broader meaning that often referred to a turning point in a stock. In many cases this involved a trend reversal, or the “waking up” of a stock within an otherwise moribund and trendless price structure.

The Ugly Duckling buy set-up is based on a similar idea. When looking for these types of set-ups I look for stocks that were prior market leaders but which have since gone into corrections and possible base-building processes. GoPro (GPRO) is one very recent example. The stock was a hot play in the latter part of 2014 before it topped in early October and began to descend. As the stock comes down, it begins to “round out” along the lows and starts to edge back up the right side, eventually clearing the 50-day moving average after a pair of subtle pocket pivot buy signals appear. We then see a huge-volume gap-up move in late April 2015 that helps to confirm the stock’s turn to the upside. This is a significant “pivotal point” for the stock, as Livermore might describe it, which leads to further upside from there after a brief pause to consolidate the strong gap-up move. Notice how immediately after that high-volume gap move GPRO pulls down into the green 20-day exponential moving average on very light volume as selling dries up, giving buyers a chance to enter the stock.
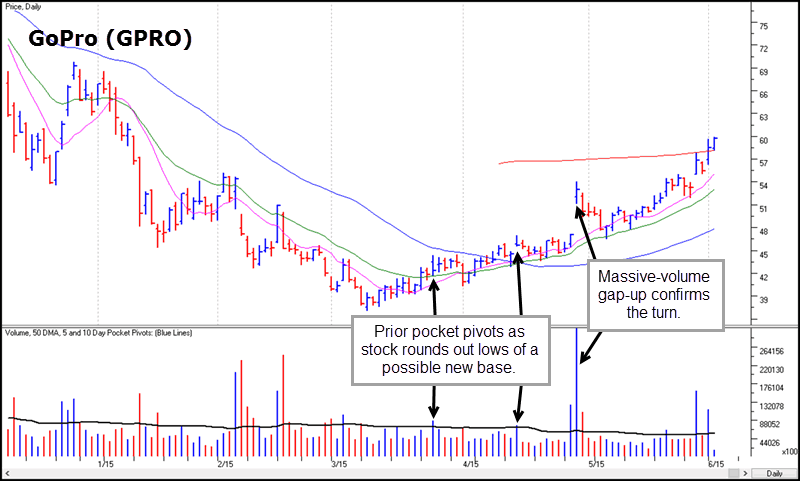
 

Chart_2_-_GPRO_Daily.gif

Chart 2 – GoPro (GPRO) daily chart. Chart courtesy of HGS Investor Software, LLC, ©2015, used by permission.

Another more recent example is Alibaba (BABA), shown on a weekly chart in Chart 2, below. The stock was a hot property right after it came public in late 2014, rocketing above the $120 price level in short order during October and November. The stock then topped and went into an extended decline before moving sideways during March and April of this year in an attempt to “round out” the lows of a potential new base. At the extreme lows of the weekly chart, we see a massive-volume outside reversal to the upside in early May 2015 that serves as a major “pivotal point” signaling that the stock has perhaps found a bottom, at least in the short term. This one-week surge off of the absolute lows, however, led to further upside from there.
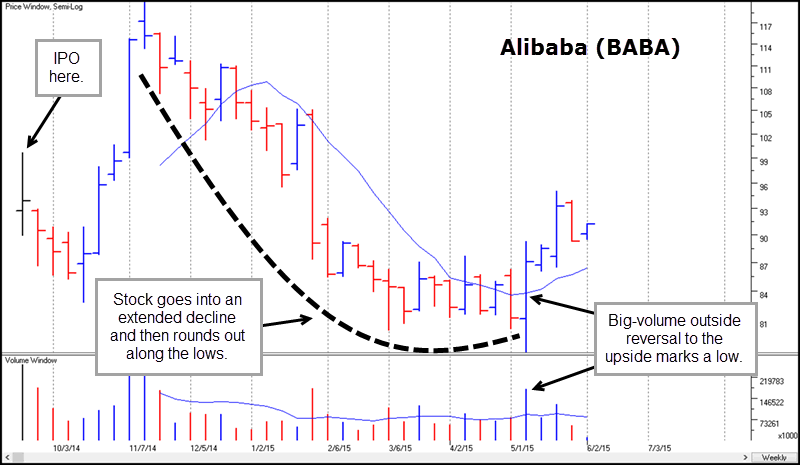
 

Chart_3_-_BABA_Weekly.gif

Chart 3 – Alibaba (BABA) weekly chart. Chart courtesy of HGS Investor Software, LLC, used by permission.

While it is not clear at the time of this writing how much further GPRO or BABA will go from here, if at all, they provide excellent examples that illustrate the basic idea of an Ugly Duckling set-up as it relates to Livermore’s concept of a “pivotal point.” In an age where a good number of market participants are well-schooled in “Technical Analysis 101,” traditional, orthodox technical methods, such as buying base breakouts, are simply too obvious to provide an edge. But by delving into the rich body of thought that emanated from the mind of Jesse Livermore, the original “O’Neil-style” investor and trader, and synthesizing this with what we observe to work in the markets in real-time, new solutions can be found.

Gil Morales is a proprietary trader and the CEO of Gil Morales & Company, LLC, a registered investment advisory firm, as well as the author of the Gilmo Report (www.gilmoreport.com). He is also a principal and managing director of MoKa Investors LLC and Virtue of Selfish Investing, LLC, as well as a co-author and co-founder with his colleague, Dr. Chris Kacher, of www.selfishinvesting.com. He and Dr. Kacher are the co-authors of the best-selling books, “Trade like an O’Neil Disciple: How We Made 18,000% in the Stock Market” (John Wiley & Sons, August, 2010), “In the Trading Cockpit with the O’Neil Disciples,” (John Wiley and Sons, December 2012), and their newest book, “Short-Selling with the O’Neil Disciples: Turn to the Dark Side of Trading” (John Wiley & Sons, April 2015). He is a former internal portfolio manager for William O’Neil + Co., Inc., where he also served as Chief Market Strategist, Vice-President and Manager of the firm’s Institutional Services group from 1997-2005, and co-authored with William J. O’Neil a book on short-selling, “How to Make Money Selling Stocks Short” (John Wiley & Sons, 2004).


Uncategorized

Jesse Livermore’s Pivotal Point: Ugly Duckling Buy Set-up

Jesse Livermore’s Pivotal Point: Ugly Duckling Buy Set-up

In last month’s column I discussed the rise of what I call the “Ugly Duckling” buy set-up where we seek to buy a stock not as it makes news highs, but instead as it begins to round out the lows of a potential new chart base or consolidation.

I also showed examples of stocks like Lannett Company (LCI) and CyberArk Software (CYBR) which had strong moves coming off the lows of pullbacks and then started up the right side of what eventually turned out to be a new base formation. These buy set-ups led to significant upside profits, as the daily chart of LCI in Chart 1, below, shows. The stock had several buy signals along the lows of the pattern before moving rapidly up the right side of a new “cup” base. However, once LCI broke out to new highs, its ensuing price move became quite volatile and eventually gave way to the downside. Thus the best move in the stock came up and off of the lows with several Ugly Duckling buy set-ups along the way.


Chart_1_-_LCI_Daily.gif

Chart 1 – Lannett Company (LCI) daily chart. Chart courtesy of HGS Investor Software, LLC, ©2015, used by permission.

Since many have been indoctrinated into the false idea that only base breakouts can be bought, some might find this Ugly Duckling concept to be somewhat radical. However, the truth is that the Ugly Duckling is firmly rooted in the investment methods and philosophy of the great trader, Jesse Livermore, the “hero” of the investment classic Reminiscences of a Stock Operator, by Edwin Lefevre. In fact, Livermore describes what he calls a “pivotal point” in Chapter 5 of the only book he ever wrote, How to Trade in Stocks, first published by Duell, Sloan & Pierce in 1940. This is not to be confused with a “pivot point,” which is the term that William J.  O’Neil adapted from Livermore’s “pivotal point” to describe a simple new-high base breakout.

As I see it, Jesse Livermore’s idea of a “pivotal point” meant far more than just a simple Technical Analysis 101 base breakout to new highs. In fact, Livermore considered a breakout to new highs to be a “late” buy point. As he is quoted in the updated edition of “How to Trade in Stocks” put out by Richard Smitten in 2006 (John Wiley & Sons), “The final time a trader can pyramid is when a stock breaks out to a clear new high on HEAVY VOLUME; this is a very good sign because it most likely means that there is no more overhanging stock to stop the progress of the stock for a while.” Instead, Livermore’s pivotal point had a broader meaning that often referred to a turning point in a stock. In many cases this involved a trend reversal, or the “waking up” of a stock within an otherwise moribund and trendless price structure.

The Ugly Duckling buy set-up is based on a similar idea. When looking for these types of set-ups I look for stocks that were prior market leaders but which have since gone into corrections and possible base-building processes. GoPro (GPRO) is one very recent example. The stock was a hot play in the latter part of 2014 before it topped in early October and began to descend. As the stock comes down, it begins to “round out” along the lows and starts to edge back up the right side, eventually clearing the 50-day moving average after a pair of subtle pocket pivot buy signals appear. We then see a huge-volume gap-up move in late April 2015 that helps to confirm the stock’s turn to the upside. This is a significant “pivotal point” for the stock, as Livermore might describe it, which leads to further upside from there after a brief pause to consolidate the strong gap-up move. Notice how immediately after that high-volume gap move GPRO pulls down into the green 20-day exponential moving average on very light volume as selling dries up, giving buyers a chance to enter the stock.


Chart_2_-_GPRO_Daily.gif

Chart 2 – GoPro (GPRO) daily chart. Chart courtesy of HGS Investor Software, LLC, ©2015, used by permission.

Another more recent example is Alibaba (BABA), shown on a weekly chart in Chart 2, below. The stock was a hot property right after it came public in late 2014, rocketing above the $120 price level in short order during October and November. The stock then topped and went into an extended decline before moving sideways during March and April of this year in an attempt to “round out” the lows of a potential new base. At the extreme lows of the weekly chart, we see a massive-volume outside reversal to the upside in early May 2015 that serves as a major “pivotal point” signaling that the stock has perhaps found a bottom, at least in the short term. This one-week surge off of the absolute lows, however, led to further upside from there.


Chart_3_-_BABA_Weekly.gif

Chart 3 – Alibaba (BABA) weekly chart. Chart courtesy of HGS Investor Software, LLC, used by permission.

While it is not clear at the time of this writing how much further GPRO or BABA will go from here, if at all, they provide excellent examples that illustrate the basic idea of an Ugly Duckling set-up as it relates to Livermore’s concept of a “pivotal point.” In an age where a good number of market participants are well-schooled in “Technical Analysis 101,” traditional, orthodox technical methods, such as buying base breakouts, are simply too obvious to provide an edge. But by delving into the rich body of thought that emanated from the mind of Jesse Livermore, the original “O’Neil-style” investor and trader, and synthesizing this with what we observe to work in the markets in real-time, new solutions can be found.

Gil Morales is a proprietary trader and the CEO of Gil Morales & Company, LLC, a registered investment advisory firm, as well as the author of the Gilmo Report (www.gilmoreport.com). He is also a principal and managing director of MoKa Investors LLC and Virtue of Selfish Investing, LLC, as well as a co-author and co-founder with his colleague, Dr. Chris Kacher, of www.selfishinvesting.com. He and Dr. Kacher are the co-authors of the best-selling books, “Trade like an O’Neil Disciple: How We Made 18,000% in the Stock Market” (John Wiley & Sons, August, 2010), “In the Trading Cockpit with the O’Neil Disciples,” (John Wiley and Sons, December 2012), and their newest book, “Short-Selling with the O’Neil Disciples: Turn to the Dark Side of Trading” (John Wiley & Sons, April 2015). He is a former internal portfolio manager for William O’Neil + Co., Inc., where he also served as Chief Market Strategist, Vice-President and Manager of the firm’s Institutional Services group from 1997-2005, and co-authored with William J. O’Neil a book on short-selling, “How to Make Money Selling Stocks Short” (John Wiley & Sons, 2004).


SIGN UP TO NEWSLETTER

Join our mailing list to receive the latest news and updates from our team.