

The Nasdaq 100 has been quite volatile lately, but the index is going nowhere. In fact, with the end of day surge on Thursday, the NQ has now printed classic bullish and bearish “head and shoulder” chart patterns. These patterns are almost mirror images of each other. It doesn’t get more ambivalent than this.
On Thursday the NQ gapped down and re-tested support once again at the High Volume Node at 4487. This is a technical floor for the market. Remember, index support is made of ‘rubber’ not glass. What matters is the closing price and on Thursday the NQ closed above this key level. Until we close below it, the gap target at 4428-4444 will remain a distant ghost.
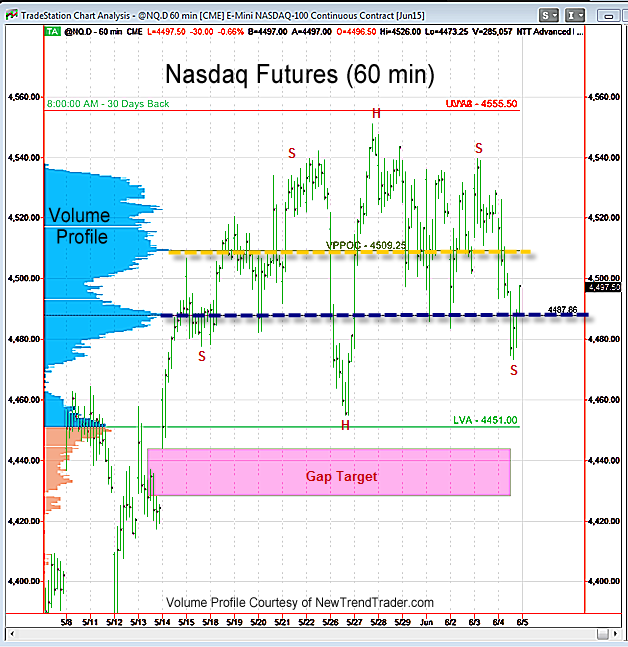
This is a market waiting for news and we will get some on Friday morning.
While my upside target for the Nasdaq futures is 4617-4627, the chances of a gap-fill run down to the magenta zone on the chart are quite real and would be healthy for the market.
A Note on Volume Profile
The histogram on the left side of the chart shows the volume distribution in the Nasdaq futures for different periods of time. Key support and resistance levels are indicated by the peaks and troughs. If you would like to receive a primer on using Volume Profile, please click here

