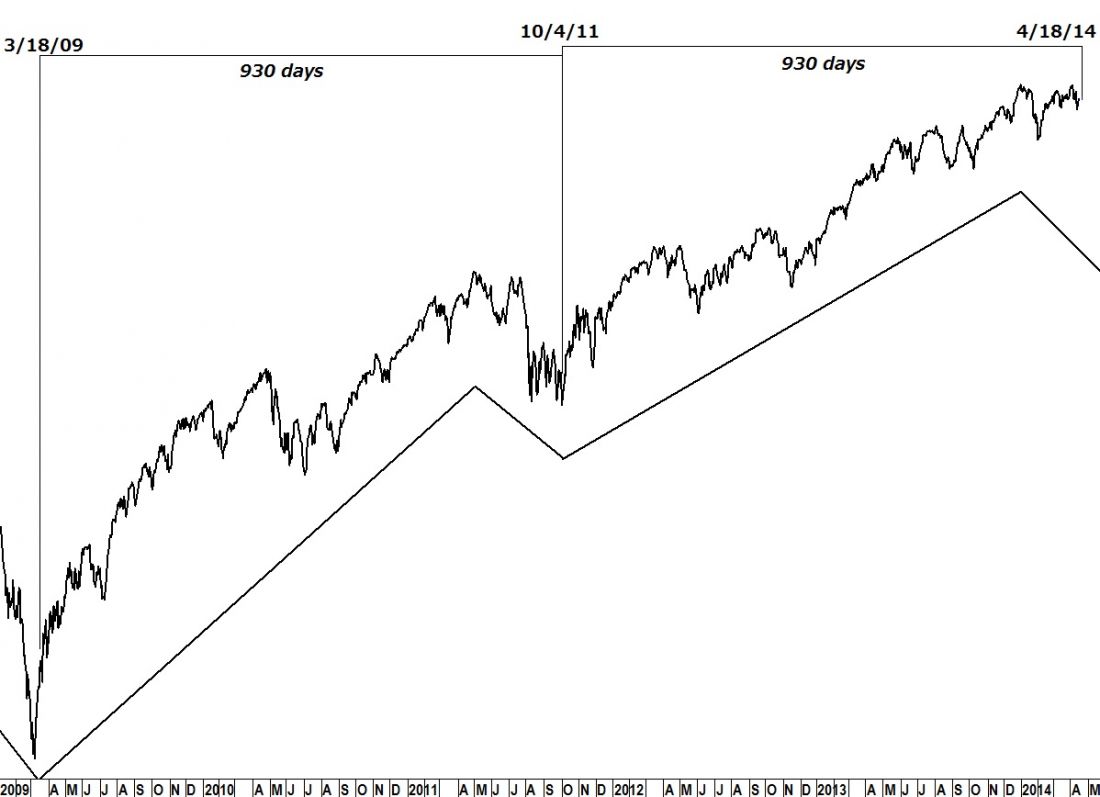
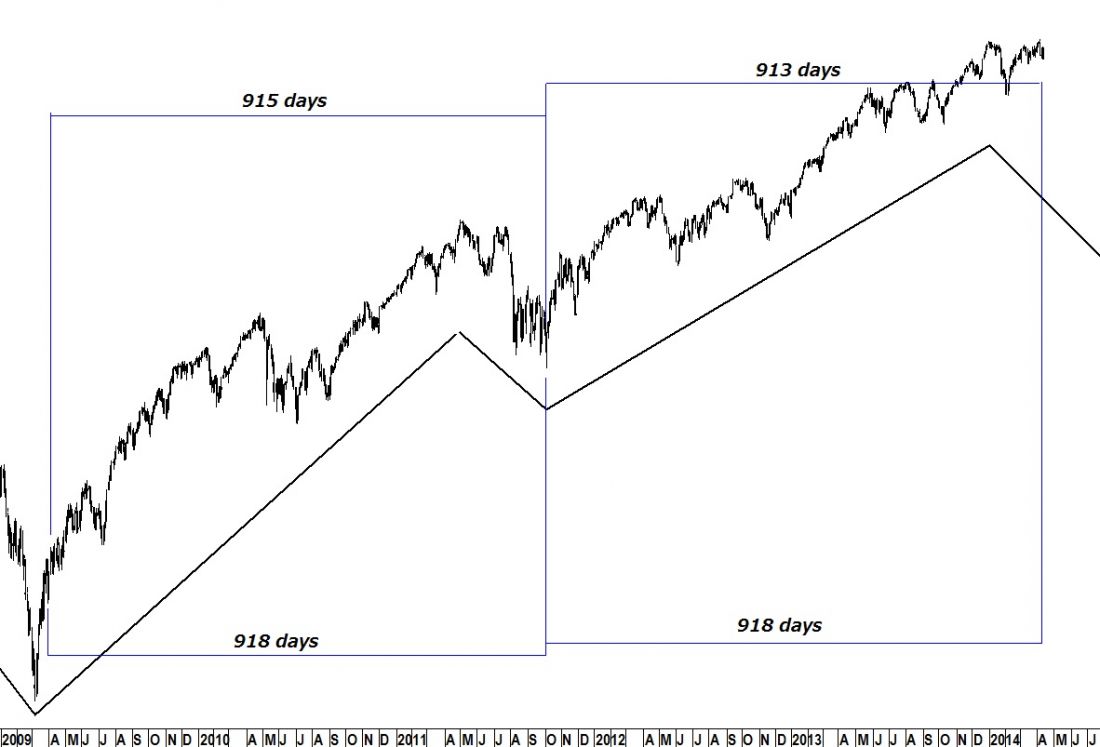
An advancing Middle Section from early 2009 (top) pointed to two separate highs last week.
[Editor’s note: Ed Carlson utilizes the work of George Lindsay in his analysis of the Dow Jones Industrial Average.]
HOW IT WORKS
The definition of a Middle Section is a period of time in which the Dow’s rate of advance slows relative to what comes both before and after it. The two measuring points are points E and C. Point E is always the second-to-last rally in a Middle Section. Point C is the day the Dow drops down from a minor topping formation and begins the decline into the low of the Middle Section at point D. In this case, points C and D are identical.
Counts are taken from the measuring points to the low of the basic cycle (10/4/11) and the forecasted high is an equidistance after that low. In Lindsay’s work lows always count to highs.
Point E on 4/2/09 counts 915 days to 10/4/11. This produced a forecast for a high on Monday, 4/7/14. The actual high fell on the previous Friday, 4/4/14.
LOOKING AT THE LEVELS
Counting from point C on 3/30/09 to 10/4/11 is 918 days and was spot-on in forecasting last Wednesday’s high – 918 days beyond 10/4/11.


= = =
Learn more about Lindsay analysis at Seattle Technical Advisors


