

Long-time readers will remember Lindsay’s admonition that following extended basic advances (929-968 days) a right shoulder is to be expected. Normally, a right shoulder is a significant high but lower than the high of the bull market. However, Lindsay allowed for the possibility of a right shoulder appearing at a higher level than the high of the basic advance. This happened in 1966 and 1973, and is occurring again in the current bull market.
Like sideways movements, no right shoulder has ever lasted more than 11 months. The Dow is still within the time period expected for a right shoulder. Eleven months from the end of the basic advance (last July) is this coming June.
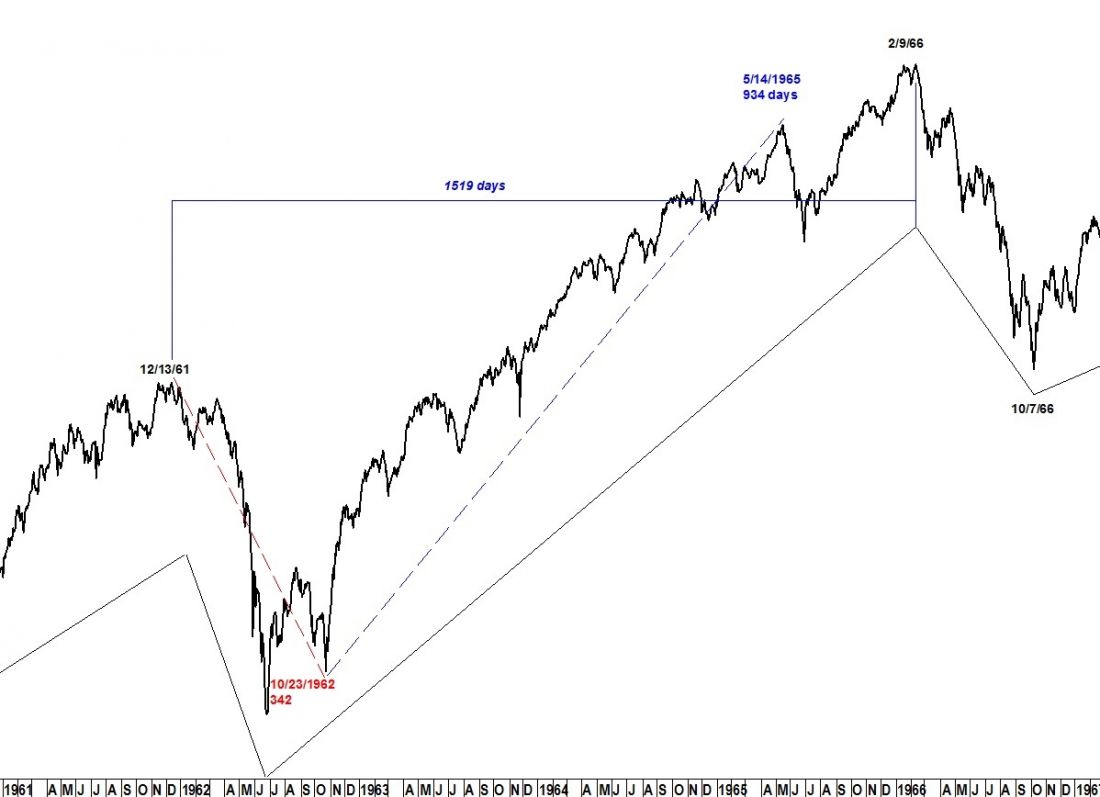
The right shoulder on 2/9/66 was 1,519 days beyond the high of the previous basic cycle on 12/13/61 (Figure 1).
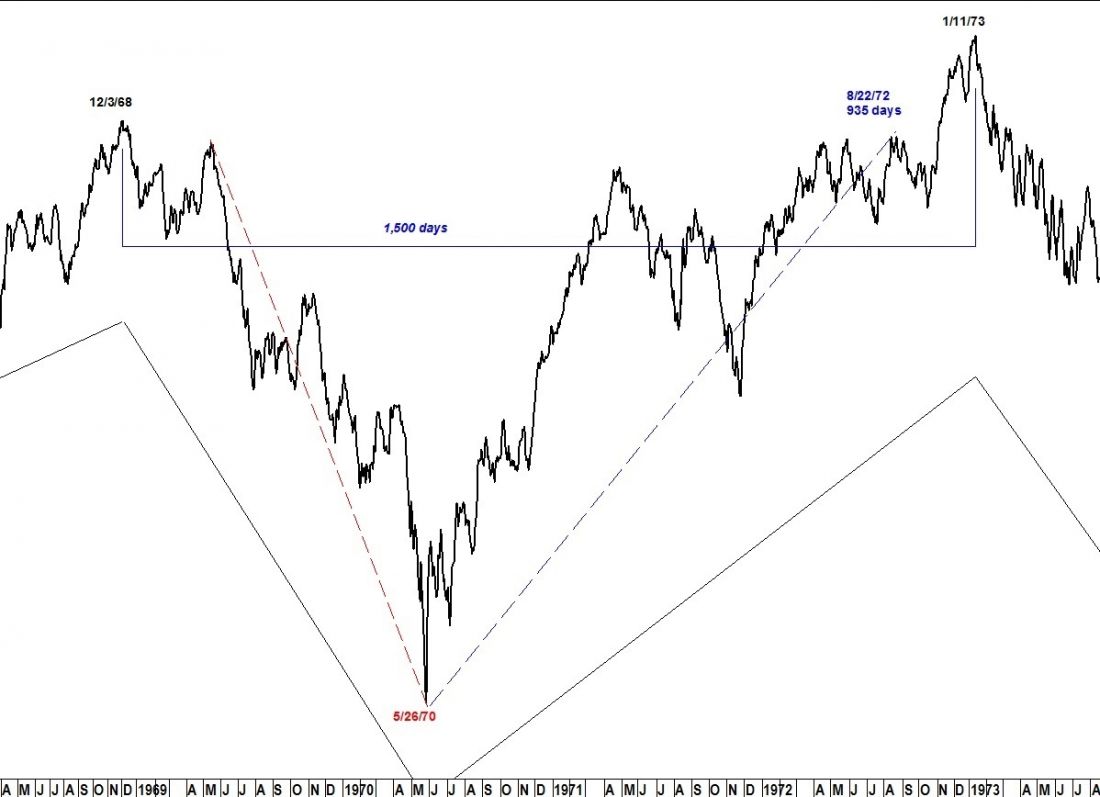
The right shoulder on 1/11/73 was 1,500 days beyond the high of the previous basic cycle on 12/3/68 (Figure 2).
The right shoulder on 4/17/1930 was not higher than the end of the basic advance but it counts 1,526 days beyond the high of the previous basic cycle on 2/11/26.
A count of approximately 1,500 days appears to be of some significance. Counting from the high of the basic cycle on 5/2/11 and using the minimum and maximum time spans from above we find a targeted time period for the high of the current right shoulder (and end of the bull market) in the period June 10-July 6, 2015.
June 10 is very close to the confirmed hybrid forecast for a top in the period June 6-9, 2015.
###
Try a “sneak-peak” at Seattle Technical Advisors.
Related Reading:
Market Master George Lindsay Focused on Time

