By: Zev Spiro
After reviewing several charts last night it is interesting to note that there are bull and bear markets in many different names and sectors, all occurring at the same time. There are currently trades and setups in both directions.
On January 18th, I highlighted a macro long opportunity in Sohu.com Inc. (SOHU). Currently, it is digesting the recent powerful up move to all-time highs and may provide a low-risk entry opportunity just above a combination of support. First, is a weekly chart that illustrates the macro pattern and breakout, and second, is a daily chart that focuses on the current re-entry opportunity.
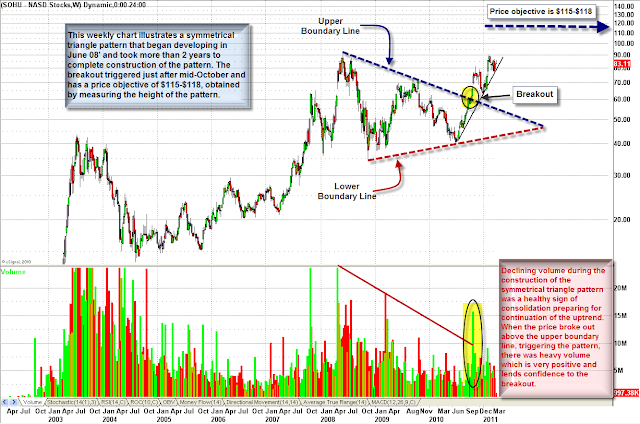
Chart 1: This weekly chart displays the continuation symmetrical triangle pattern that began developing in June 08’, and broke out in October 2010. Target: price objective of $115 – $118 is obtained by measuring the height of the pattern and expanding higher by the same distance, from the breakout.
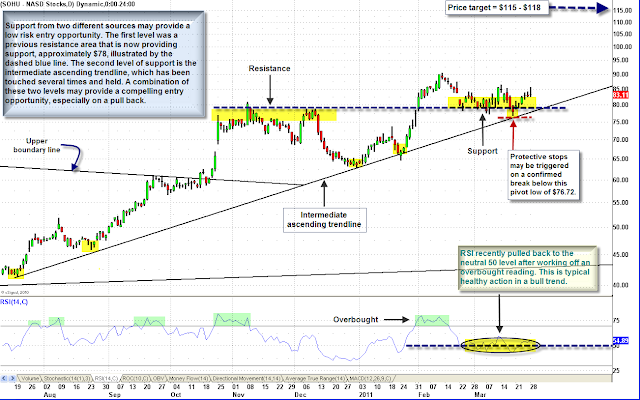
Chart 2: Support from two different sources may provide a low risk entry opportunity. The first level was a previous resistance area (from October to December), that is now providing support, approximately $78. The second level of support is the intermediate ascending trend line, which has been touched several times and held. A combination of these two levels may provide a compelling entry opportunity, especially on a pull back. Target: objective is $115-$118. Protective stops: may trigger on a confirmed*** move below the March 18th pivot low of $76.72.
UPDATE:
Goldman Sachs Group, Inc. (GS): Market Letter 2/23/11 – Protective stops may be trailed lower to trigger on a close above the 3/22 high of $162.21.
***Note: I often mention Confirmation needing to be present for a valid breakout. The following link is to an article titled “For Traders Only: A Guide to Confirmation” that I wrote for Minyanville Media, Inc.
*DISCLOSURE: Short GS
This material is being provided to you for educational purposes only. No information presented constitutes a recommendation by T3 LIVE or its affiliates to buy, sell or hold any security, financial product or instrument discussed therein or to engage in any specific investment strategy. The content neither is, nor should be construed as, an offer, or a solicitation of an offer, to buy, sell, or hold any securities. You are fully responsible for any investment decisions you make. Such decisions should be based solely on your evaluation of your financial circumstances, investment objectives, risk tolerance and liquidity needs. Visit the T3Live Homepage, Virtual Trading Floor, and Learn More About Us.


