September finished at a monthly closing high on the S&P 500 at 1,440.67, a level not seen since December 2007, when the S&P closed at 1,468.36. The market has come a long way since the dark days of late 2008, early 2009. What a difference a few trillion dollars worth of stimulus makes.
ALL ABOUT PRICE
In any event, as a technician, price for me is god. Yes, volume and perhaps time play a factor too, but at the end of the day, it is price that we trade.
BIG PICTURE
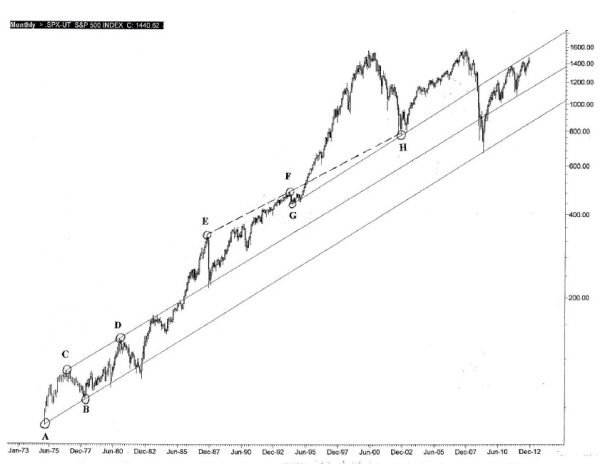
For a long-term view, I present to you a chart going back to 1975, it is a monthly candlestick chart based on the S&P 500 on a logarithmic scale. There are four controlling trend lines marked. Point A from the low in January 1975 (68.65) connects with the low from March of 1978 (86.45), point B. This gives us a trend line that amazingly captures the February 2009 low. The market has not closed lower than this trend-line on a monthly basis. (In truth, the June and July 1982 closes were below this line, but they were contained, or engulfed within March 1982’s price action.) This furthers the evidence that this is a pretty important and strong trend-line defining the market trend over the last 37 years.
THERE’S MORE
But wait. It does get more interesting.
We can also draw an upper channel trend-line connecting the highs from September 1976 (108.45), point C and November 1980 (141.96), point D. This line, coincidentally, is parallel to the lower trend-line A-B. In November of 1985 we closed above this upper trend-line on a monthly closing basis. The market then accelerated upwards, culminating in the crash of October 1987.
But even with this terrifying crash, the market only made it back to the upper trend-line (C-D) and it couldn’t even close below it on a monthly basis! Talk about a raging bull.
Since the market now established C-D as its support line, we have to look for another upper trend-line. This is obtained from the high of August 1987 (337.89), point E, with the high from January 1994 (482.85), point F. This trend line did a fine job in capturing the October 2002 low of 768.63, point H. Trend lines which capture important lows, tend to be important into the future as well, where they will either act as support or resistance. One last trend line I have drawn connects the low from April 1994 (435.86), point G, to the low in October 2002 (768.63), point H.
KEY LEVEL
If we break above this upper trend-line, currently around 1,600, we will be in new territory. In cases like this, I like to refer to point & figure charts (not shown). These charts always have clear targets in mind and the current target for the S&P is at 1,550. Since this other charting method is pointing to a possible top at 1,550, I expect heavy resistance in the mid-1,500 to 1,600 level in the S&P. This will bring us back to the old highs from M
arch 2000 at 1,553.11 and October 2007 at 1,576.09.
LOOKING AHEAD
All told, I expect a run to 1,550 – 1,600 on the S&P in the next few months. The critical part will be where we go from there. From a technical standpoint, we can continue upward past 1,600 hugging the trend line marked G-H, which has already served as resistance back in May 2011. Interestingly, the sell-off from the May 2011 high at 1,370.58 ended at support line C-D, which remember, was established from the market highs in 1976 and 1980!
BOTTOM LINE
In summary, there is 8-10% upside in the S&P 500 from here, at that point it would be wise to lighten up on stocks, perhaps even sit on the sidelines until we have a resolution to the upside. I would also not rule out a drop back to the A-B line, which is near 1,000.
= = =
Looking for specific trading ideas? Read our Daily Markets section here.