

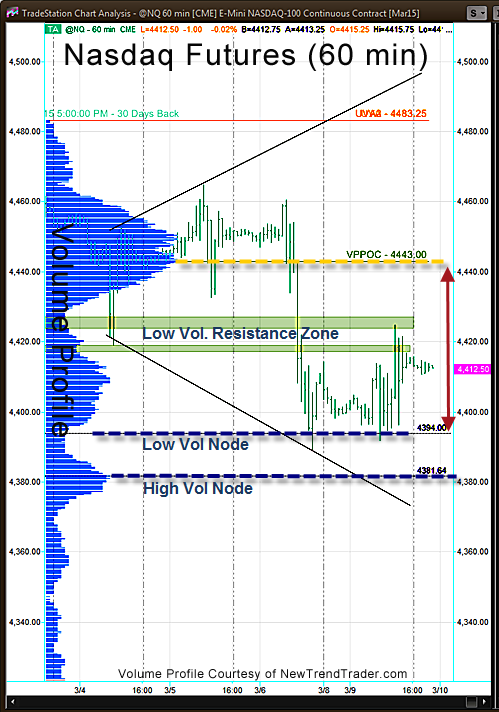
On Monday the Nasdaq 100 found support just above our 4381 target at a Low Volume Node at 4394.
Low Volume Nodes are price levels where very few traders have been interested in transacting business. The fact that these zones actually function as support seems illogical, at first, but Monday’s action shows two instances where they were solid Support and Resistance (small red circles).
If the NQ can rally up the Low Volume Node around 4425, it will get back to the Volume Point of Control at 4443.
If, however, it fails to gain upside traction, a retest of Monday’s low around 4394 is likely. And if that support fails, I expect the NQ to reach our target of 4381. I’ve zoomed in on this chart to show more detail, so remember that 4381 is not necessarily a solid floor. This was discussed in the previous update.
A Note on Volume Profile
The histogram on the left side of the chart shows the volume distribution in the S&P futures for different periods of time. Key support and resistance levels are indicated by the peaks and troughs.
#####
If you would like to receive a primer on using Volume Profile, please click here.

