ES broke out the neckline of the inverted H&S pattern last weekand made a continuation move higher.
The first measurement target for the breakout is around 1382.75, which could be our weekly high area.
Today price may make new high as it often does on the first trading day of a new month. We may see new highs in overnight trading or in the early morning session.
But there is also the possibility the price may pull back to the 1343.75 line or lower to 1336-35 range to test the broken previous resistance lines.
A new high followed by a pullback is a likely pattern for this week.
This is an excerpt from the Naturus weekly Market Preview. To see the full preview, visit http://naturus.com
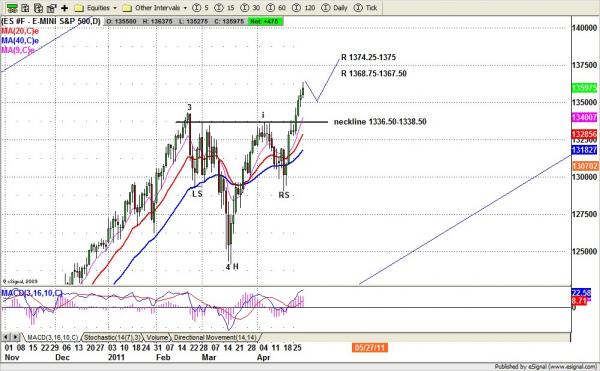
S&P 500 e-mini futures – Daily chart
ESM1