

In this column in late October, I showed a ratio-chart of the Nikkei 225 versus the MSCI world index and explained how the breakout over a declining trendline, which was showing on the chart at that time, suggested great times ahead for the Japanese stock market.
BIG MOVE
Since then the Nikkei has advanced 46%. As an old stock broker once told me “Trees don’t grow to the sky” so the question becomes ‘when is the top?’ I would argue that an important top is here.
KEY LEVELS
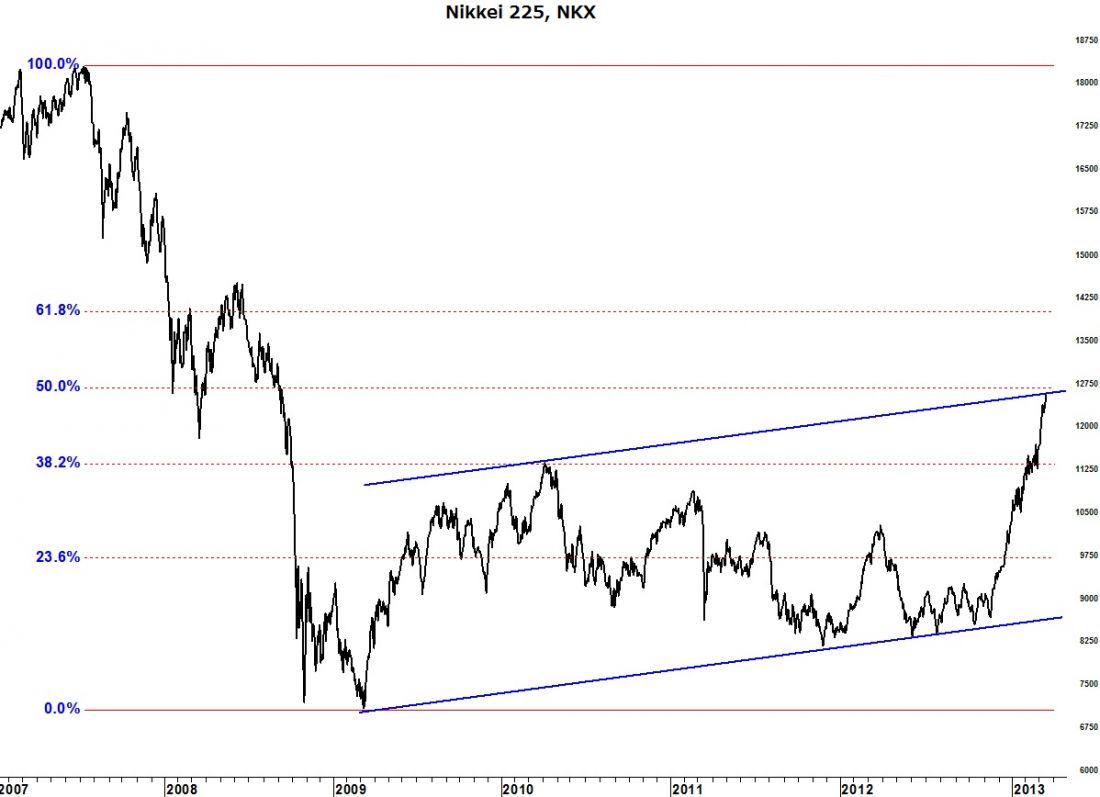
Overlaying Fibonacci retracements on the 2007-2009 decline we can see that the rally has retraced 50% of that decline. Any one of the retracement levels is a natural stopping point so which one is it? I find it fascinating that just as the index is reaching the 50% retracement level that it is also about to tag a trend line drawn parallel to the lower trend line between the lows of 2009 and 2012.
The combination of these forces should be enough to turn back the advance.
= = =

