
Most traders do not understand volatility.
Volatility is simply the amount the stock price fluctuates, without regard for direction.
There is Historical Volatility.
And there is Implied Volatility.
Historical volatility is a measure of how much the price of a security, such as a stock or an options contract, has moved over a given period of time. It is calculated by taking the annualized standard deviation of the security’s percentage change in price. In other words, it looks at how much the price has fluctuated in the past and annualizes it to give you an idea of how much movement you can expect in the future. Because it is backwards looking, historical volatility can’t predict future movements, but it can give you an idea of how volatile an asset is. For options traders, historical volatility is an important metric to monitor because it can help gauge the risk of an options contract. If the historical volatility is high, then the contract is more likely to be historically expensive; if it’s low, then the contract is less likely to be inexpensive. However, it’s important to remember that historical volatility is only one factor to consider when trading options.
A very basic way of understanding historical volatility is simply dividing the current price by the annual trading range.
Let’s say a stock is currently trading at $50 per share.
It’s 52-week high is $75. Its 52-week low is $25. From this information we can determine that it has had a $50 point trading range in the past year. We divide its most recent close of $50 per share by its annual range of $50 and we can compute that the volatility is 100%. While this definition does not get involved with the historical standard deviation, it does provide a very basic understanding of what has happened in the past.
On the other hand, implied volatility (IV) is the expected volatility of a financial instrument over the period of the option. It is a measure of expected future price changes, which is implied by the market price of an option. The higher the IV, the greater is the expected price movements and vice versa. When options traders talk about “implied volatility,” they are referring to the volatility that is “implied” by the current option prices. In other words, it is the market’s forecast of itself. Implied volatility can be measured for both call and put options, and it is usually expressed as a percentage. For example, if an option has an IV of 20%, this means that the market expects the underlying security to move up or down by 20% over the life of the option. Therefore, when trading options, it is important to keep an eye on IV because it can have a big impact on option prices.
Without getting overly technical/ or mathematical it is important to understand the basics of options pricing.
All option contracts consist of the following:
- Strike Price of the Option
- Distance strike price is from the current price
- Current interest rate
- # of days till expiration
Within these elements the implied volatility is determined by the market itself. Essentially it is how the market defines risk. You can review the basics of options in our previous articles.
Options Trading for Beginners – Part 1
Options Trading for Beginners – Part 2
Options Trading for Beginners – Part 3
Options Trading for Beginners – Part 4
ONE very important note: All options are deteriorating assets.
This means that an options contract has a limited lifespan and all things being equal it will normally be worth less tomorrow than today, since tomorrow is closer to the expiration date. But what is also important to note is that over the last 14 years since the Great Financial Crisis, the Federal Reserve had pushed interest rates down to zero to try and stimulate the economy. Options pricing very much incorporates interest rates into the pricing of options. Since the Fed is talking about raising interest rates into 2023, the expectations are that this would make options more expensive in the future than they are today. The simplest way to think about this is to recognize that TIME has a cost associated with it. When Volatility and interest rates increase, time becomes more expensive.
The key to success in trading options relies on two things:
- Are they trending?
- How is their pricing from a historical perspective?
The Volatility Index (VIX) was created in 1993 by the CBOE (Chicago Board Options Exchange). It is a measure of implied volatility of the S&P 500 Index, which is a benchmark index for U.S. stock market performance. In other words, it measures how much options pricing is implied by the market for a given period. The VIX is often referred to as the “fear index” because it spikes when investors are worried about market declines. The index generally has a range of 10-30; readings below 20 are considered low and indicative of a stable or bullish market, while readings above 30 are considered high and indicative of a bearish or volatile market. The VIX was created in 1993 and has since become one of the most closely watched indicators by traders and investors alike. While the VIX is not a perfect predictor of market direction, it is often used as a barometer of investor sentiment and can provide valuable insights into market conditions. The VIX tends to be more volatile than the stock market itself, so it can be used as a tool for hedging against market declines.
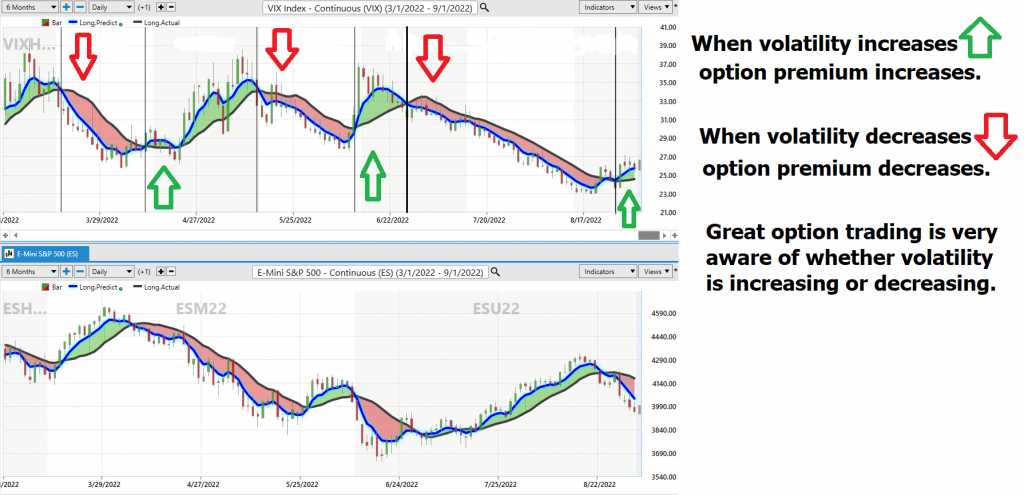
What is also important for options traders to discern is whether option volatility is stable, decreasing or increasing.
When volatility is decreasing option sellers have the probability in their favor as the premium that they sold is worth less tomorrow than today.
When volatility is increasing option buyers have the probabilities in their favor as the premium, they pay for the option is worth more tomorrow than today even if prices stay the same.
To be successful trading options you need to be able to comprehend that options pricing is as elastic, like a rubber band. The more the rubber band stretches the more expensive the options are priced. When options become more expensive it is an indication that the market expects more risk over the same time frame.
A short analogy is in order.
Here in Florida, we have hurricane season from the 4th of July till Thanksgiving. Everyone in Florida knows this is hurricane season. If a storm is spotted in the gulf or Atlantic Ocean today and it has a decent probability of hitting Florida anybody who is trying to purchase storm insurance would expect to pay more for that insurance today than yesterday. The insurer will charge more to compensate for the greater risk that exists for carrying your insurance policy. This is identical to how the options markets operate and price options.
Here is a 10-year monthly chart of the Volatility Index.
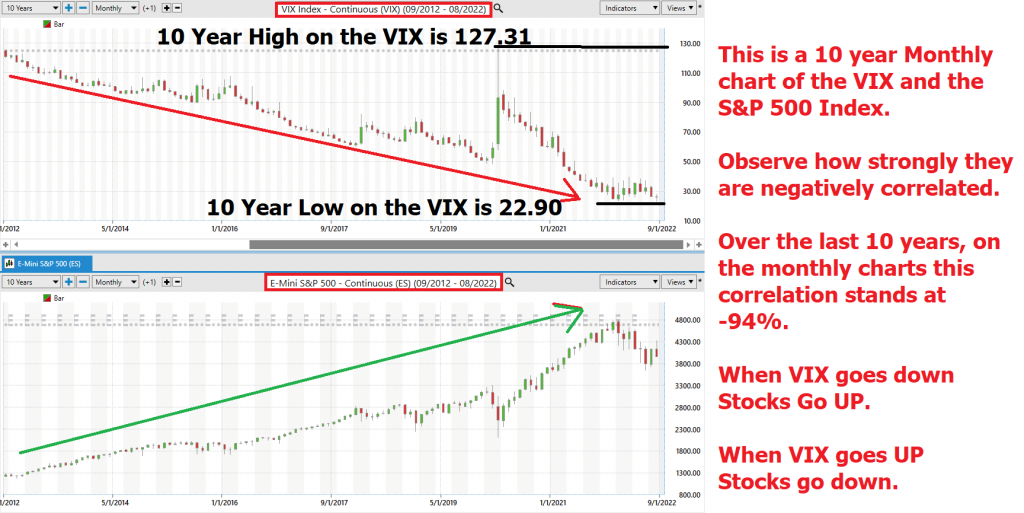
There are a couple of very profound observations you can make when studying the VIX. First off, notice the inverse correlation that the VIX has to the price of the S&P 500. When the VIX goes down, Stocks tend to go up and vice versa. Over the last 10 years on the monthly charts this correlation stands at -94%. This means that 94% of the time the markets move opposite to one another.
In April 2020 at the start of the pandemic the $VIX was valued at 84.88% which historically is very high. What the implied volatility was stating at that time was that in 12 months’ time, there was a 68% probability that the market was forecasting that it could be 88.8% higher or lower in 12 months’ time.
What happened?
In the following 12 months the S&P 500 had rallied 40.6% and the VIX had dropped to 43.69%. In other words, the options pricing was implying that fear was decreasing, and options were becoming less and less expensive with each passing day.
What about today?
The graphic below tells an identical story.
The top chart is the $VIX. The bottom chart is the S&P 500 Index.
The $VIX recently closed at 25.71% which means that the implied volatility is forecasting that there is a 68% probability that in 12 months’ time the S&P 500 could be 25.71% higher or lower than where we are currently trading. More importantly, the VIX is rising which means volatility is increasing, which further means that buying options is the higher probability trade at this moment. In other words, the options market is implying that time is becoming more and more expensive with each passing day.
Seasoned traders can tell if options are expensive or inexpensive by looking at the implied volatility of the S&P 500 Index. The implied volatility measures the value of the underlying asset, the strike price, the time to expiration, and interest rates. When implied volatility is rising, it means that options are more expensive relative to other times when implied volatility is low.
Right now, implied volatility is increasing. This means that time is gradually becoming more expensive and that buying puts and calls is a higher probability strategy. It also means that fear is increasing. In the present time environment, the best option trading tactics are as follows:
Buying Straddles
This involves buying a put and call option of the same strike price and same expiration. As volatility increases the premiums on this combination will also increase. The total risk is the premium paid. The expectation is that as volatility increases the options will become more expensive.
The graph below illustrates this LONG VOLATILITY strategy perfectly and concisely.
In many regards this strategy is counterintuitive because you are not trading the options based upon a directionality, but rather anticipating that a volatility increase will make the premiums more expensive.
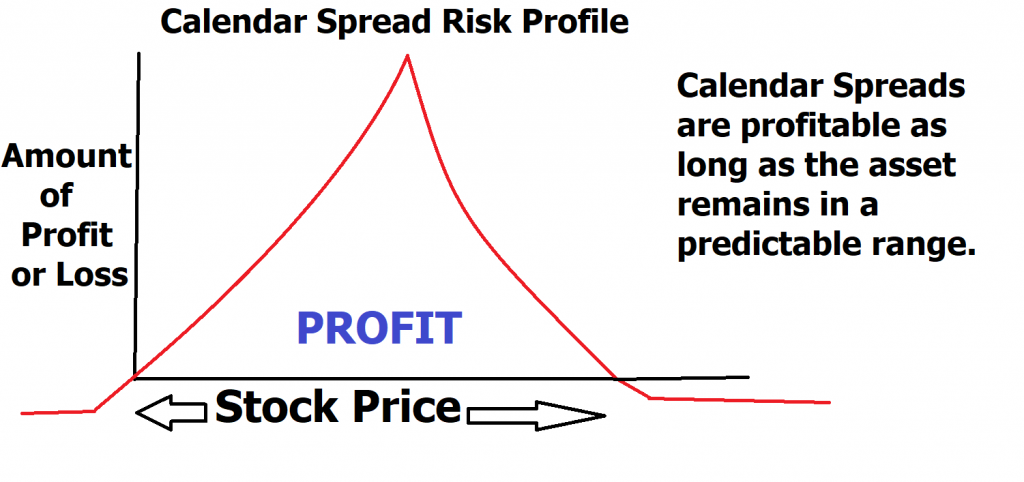
A second long volatility strategy is to Buy a Calendar spread. This tactic involves creating a spread where you sell the front month option and buy a distant month option. You are in essence buying more time than you are selling.
Whenever you trade options, you are trading TIME. Buyers are giving themselves more opportunities for the price to move in their direction. The bottom line to this reasoning is that “TIME is Money” and the more time you buy, the more it is going to cost you. Calendar spreads are also known as ‘time spreads,’ ‘counter spreads,’ ‘horizontal spreads,’ ‘inter-delivery’ and ‘intra-market’ spreads. I also like to think of them as capturing time decay spreads for reasons which will quickly become obvious.
Whenever you combine the risk profiles of owning a distant call with being short a nearby call, this is what a calendar trade looks like:
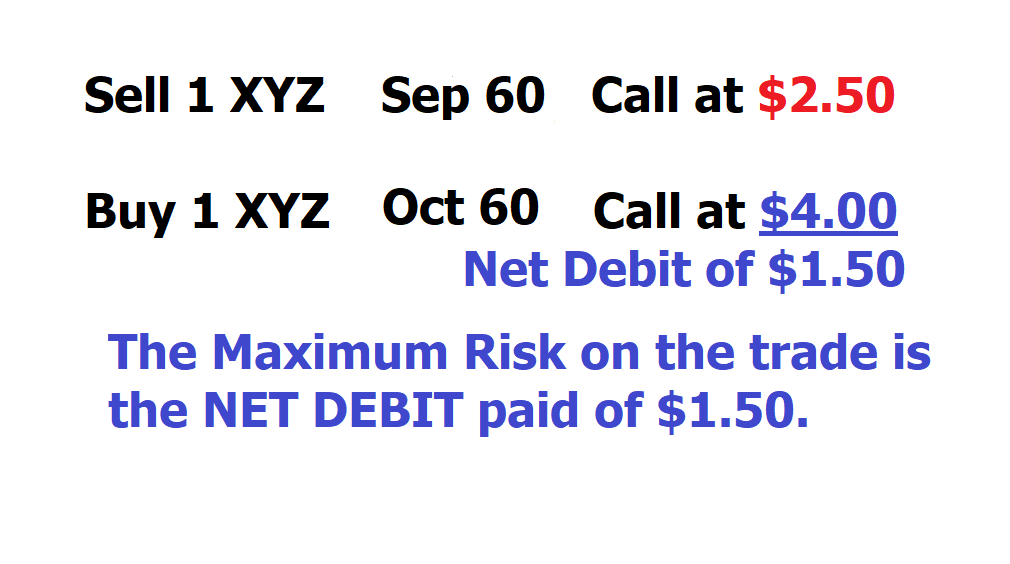
Note if the trader were to simply buy the October 60 call expiration, the cost would have been $400 dollars, but by employing this spread, the cost required to make and hold this trade was only $150, making the trade one of better margin and less risk.
Since the strike prices are identical on this trade, we can quickly determine that the risk is whatever DEBIT amount was paid to put on this calendar spread. In this instance, it is $1.50 per share. But since we are dealing with options with two different expiration dates, we need to clarify this in greater detail to understand where the opportunity in this trade is. The purpose of the trade is to profit from the passage of time and/or to benefit from an increase in implied volatility in a directionally neutral strategy.
The September Option expiration is 3 weeks away.
The October Option Expiration is 7 weeks away.
We can do the math on this trade and quickly recognize that the September option will decay by $83.33 every week. The October option will only decay by $57 per week.
The difference between the two is profit but more importantly as volatility increases the NET DEBIT paid between both options will also increase.
This is what the risk/reward profile would look like.
These two strategies are among the top trading tactics that options traders would use in a trading environment when implied volatility is rising.
Implied volatility is a number that quantifies the motion of the underlying asset for a given option. It Can be thought of as the “expected” motion of the underlying asset, taking into account all information that is known at the time – both public and private. Professional traders use this number to help them make decisions about trading options. The higher the volatility, the greater the risk but also the greater the reward. Volatility can be affected by many factors, including economic news, political events, and even rumors. As such, it can be difficult to predict. However, careful analysis of past price movements can give traders an edge in forecasting future volatility – and, as a result, future option prices.
The challenge facing every trader is trying to make sense of the tsunami of financial information to make better trading decisions.
Quite a challenge!
Traders should brace themselves for some serious volatility.
Traders who can adapt will be handsomely rewarded.
Buy and hold investors may be in for a wild ride.
If you understand we are living in a Brave New Financial World you also understand you need new tools to make sense of the madness. Interest Rates were pushed to negative territory around the world in the “hopes” that it will stimulate economic growth.
If the Fed follows through on their plans to continue raising interest rates into 2023, all things being equal we should expect to see volatility rise substantially.
What traders need is a solution that takes these massive distortions into effect and delivers statistically sound decision making. This is what a.i. based trading delivers.
Artificial Intelligence is not a would be nice to have tool. It is essential for today’s quickly changing financial landscape.
Your assets… your savings… your retirement… everything you have worked so truly hard for… they do not have to be at risk any longer.
Artificial Intelligence is no longer just for the large Wall Street Mutual Funds and ultra-wealthy. Today small traders are getting big results because of a.i.
Intrigued? Join us for a Free Live Online Training Lesson.
Discover why artificial intelligence is the solution professional traders go-to for less risk, more rewards, and guaranteed peace of mind.
Visit with us and check out the a.i. at our Next Live Training.
It’s not magic. It’s machine learning.
Make it count.

IMPORTANT NOTICE!
THERE IS SUBSTANTIAL RISK OF LOSS ASSOCIATED WITH TRADING. ONLY RISK CAPITAL SHOULD BE USED TO TRADE. TRADING STOCKS, FUTURES, OPTIONS, FOREX, AND ETFs IS NOT SUITABLE FOR EVERYONE.
DISCLAIMER: STOCKS, FUTURES, OPTIONS, ETFs AND CURRENCY TRADING ALL HAVE LARGE POTENTIAL REWARDS, BUT THEY ALSO HAVE LARGE POTENTIAL RISK. YOU MUST BE AWARE OF THE RISKS AND BE WILLING TO ACCEPT THEM IN ORDER TO INVEST IN THESE MARKETS. DON’T TRADE WITH MONEY YOU CAN’T AFFORD TO LOSE. THIS ARTICLE AND WEBSITE IS NEITHER A SOLICITATION NOR AN OFFER TO BUY/SELL FUTURES, OPTIONS, STOCKS, OR CURRENCIES. NO REPRESENTATION IS BEING MADE THAT ANY ACCOUNT WILL OR IS LIKELY TO ACHIEVE PROFITS OR LOSSES SIMILAR TO THOSE DISCUSSED ON THIS ARTICLE OR WEBSITE. THE PAST PERFORMANCE OF ANY TRADING SYSTEM OR METHODOLOGY IS NOT NECESSARILY INDICATIVE OF FUTURE RESULTS. CFTC RULE 4.41 – HYPOTHETICAL OR SIMULATED PERFORMANCE RESULTS HAVE CERTAIN LIMITATIONS. UNLIKE AN ACTUAL PERFORMANCE RECORD, SIMULATED RESULTS DO NOT REPRESENT ACTUAL TRADING. ALSO, SINCE THE TRADES HAVE NOT BEEN EXECUTED, THE RESULTS MAY HAVE UNDER-OR-OVER COMPENSATED FOR THE IMPACT, IF ANY, OF CERTAIN MARKET FACTORS, SUCH AS LACK OF LIQUIDITY. SIMULATED TRADING PROGRAMS IN GENERAL ARE ALSO SUBJECT TO THE FACT THAT THEY ARE DESIGNED WITH THE BENEFIT OF HINDSIGHT. NO REPRESENTATION IS BEING MADE THAT ANY ACCOUNT WILL OR IS LIKELY TO ACHIEVE PROFIT OR LOSSES SIMILAR TO THOSE SHOWN.

