
![]()
The Foot Locker, Inc. is an American sportswear and footwear retailer, with its headquarters in Midtown Manhattan, New York City, and operating in approximately 28 countries worldwide. The company was founded in 1974 by William J. Goldman Sr. Through its subsidiaries, it operates as an athletic footwear and apparel retailer. The company engages in the retail of athletic footwear, apparel, accessories, equipment, and team licensed merchandise under the Foot Locker, Lady Foot Locker, Kids Foot Locker, Champs Sports, Eastbay, atmos, WSS, Footaction, and Sidestep brand names. As of January 29, 2022, it operated 2,858 retail stores in 28 countries across the United States, Canada, Europe, Australia, New Zealand, and Asia; and 142 franchised Foot Locker stores located in the Middle East and Asia. They employ approximately 32 thousand people and have annual sales of roughly 8 billion dollars.
Foot Locker ($FL) has a market cap of $3.51 billion and trades on average 2.9 million shares per day.
In 2021, the economy was firing on all cylinders, thanks to an accommodative stance by the U.S Federal Reserve and low interest rates and stimulus checks that helped boost consumer demand. Based upon these factors, Foot Locker reached its highest level of sales since 1996-97 at $8 billion dollars per year. The problem that analysts and investors have with the company today is its level of inventories have risen 37% year over year. With a slowing economy, and higher interest rates and no government stimulus this appears to be a recipe for a substantial company contraction. Now that we are through the “Back To School” season, Wall Street waits for earnings calls and analysts to update their opinions and forecasts on the company’s growth prospects. Will $FL write down its inventories in future quarters, or will it be able to increase sales at a level that justifies the recent inventory growth?
As if inventory problems were not enough, many analysts also point to the current economic slowdown with numerous indicators pointing towards a recession later in 2022 and early 2023.
In this weekly stock study, we will look at and analyze the following indicators and metrics which are our guidelines which dictate our behavior regarding a particular stock.
- Wall Street Analysts’ Estimates
- 52-week high and low boundaries
- Vantagepoint A.I. forecast
- The Best Case – Worst Case Scenarios
- Neural Network Forecast
- Daily Range Forecast
- Intermarket Analysis
- Our trading suggestion
We don’t base our trading decisions on things like earnings or fundamental cash flow valuations. However, we do look at them to better understand the financial landscape that a company is operating under.
Analysts Ratings
Based on 9 Best Performing Wall Street analysts offering 12-month price targets for Foot Locker in the last 3 months. The average price target is $37.78 with a high forecast of $43.00 and a low forecast of $29.00. The average price target represents a 2.80% change from the last price of $36.75.
These estimates clearly show that the majority of Wall Street Analysts who follow the stock think it is either overvalued or fairly valued at current price levels.
We will watch these Wall Street estimates very closely and would advise that you do as well.
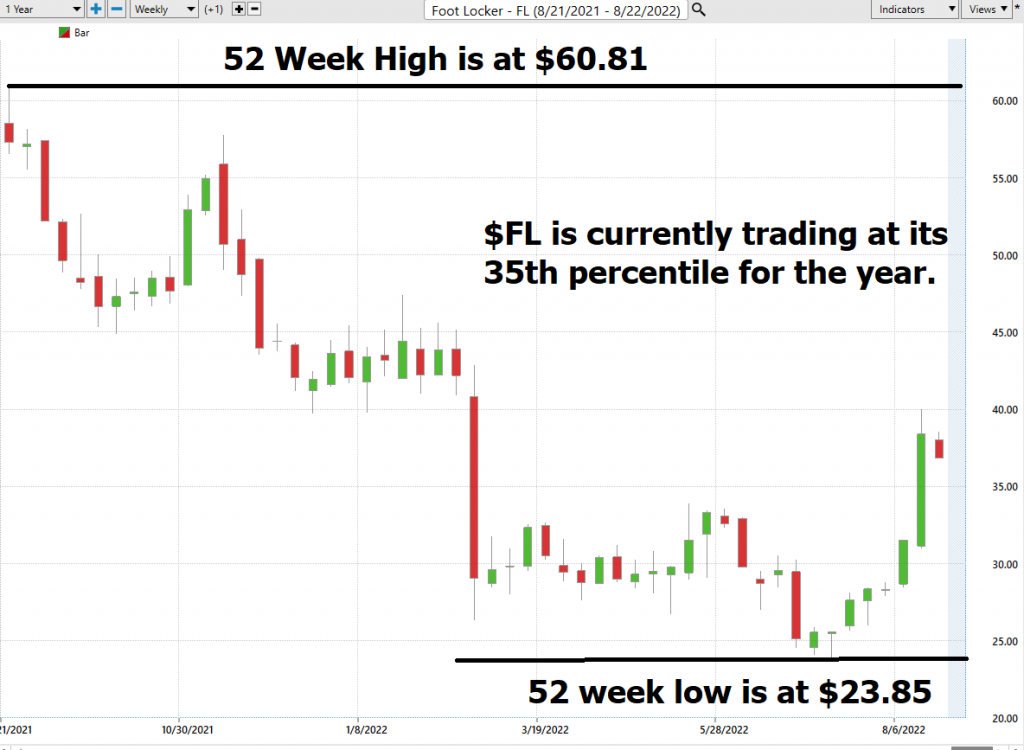
52-week High-Low Chart
Over the past year we have seen $FL trade as low as $23.85 and as high as $60.81. This tells us that the annual trading range is $36.96. Its last close was $36.96 which means the company is trading at its 35th percentile for the year.
When we divide the annual trading range by 52 weeks, we produce an expected weekly trading range of .71.
Here is the annual 52-week chart of $FL so that you can see the price journey it has taken over the last year.
What we find incredibly useful and practical is to be very aware of the trading ranges for the weekly, monthly and quarterly time frames. The trading ranges for those time frames provide excellent volatility benchmarks that traders can use to know what the market has offered during that period. To a large extent this data provides realistic expectations of future market behavior.
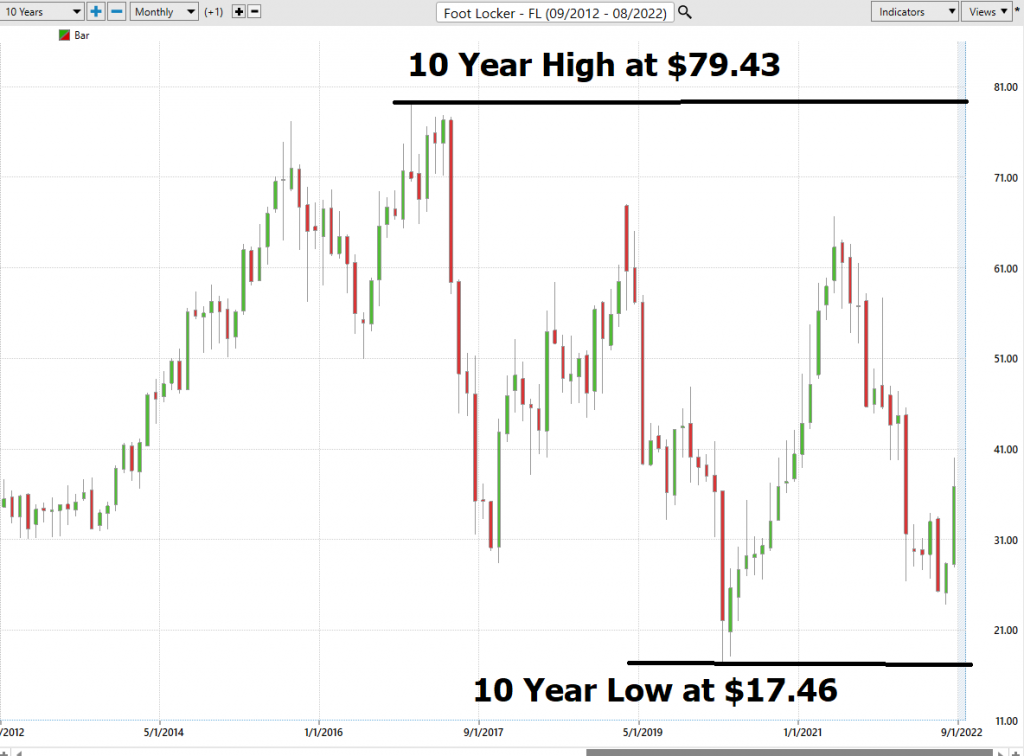
Next, we look at $FL in the context of its long term chart.
To Wall Street Analysts, have their forecasts bunched around the current price levels.
Now we compare $FL to other opportunities in the broader market indexes.
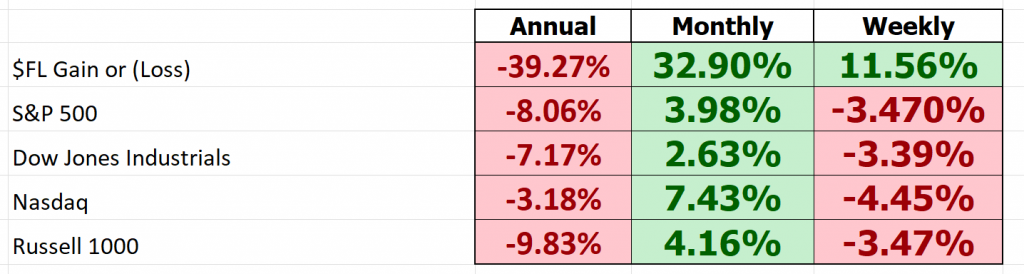
So, in $FL we have an asset that has performed much worse than the broader stock market indexes. With significantly higher volatility and most of its gains have occurred in the past 30 days. Notice how it is still down 39.27% year over year even after the massive rally which occurred.
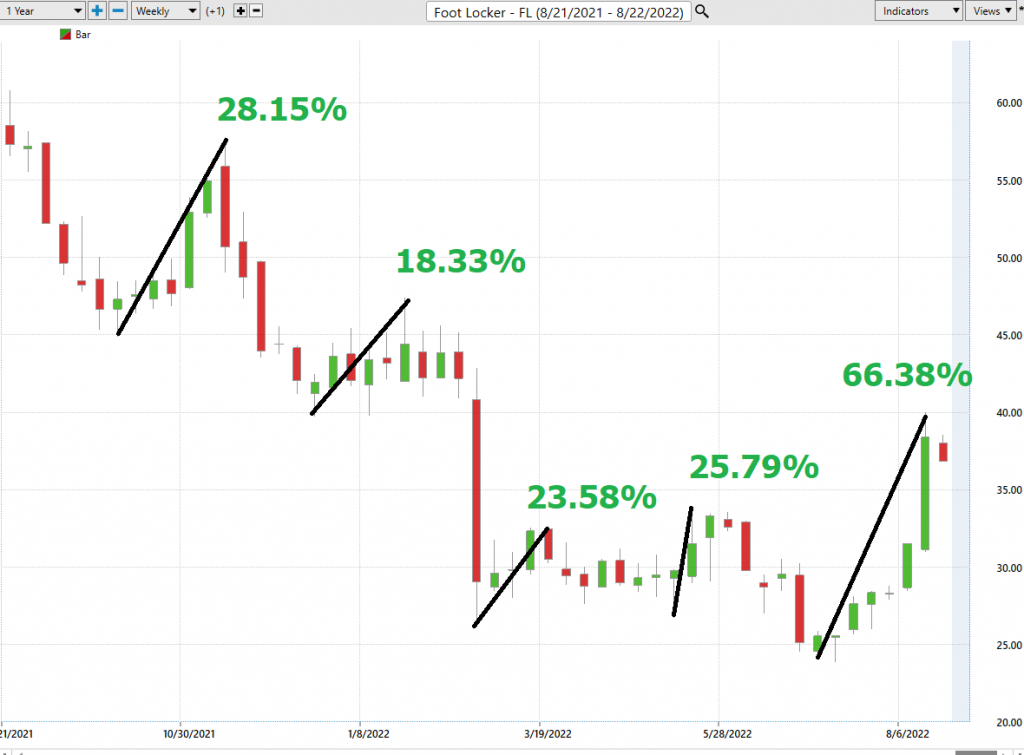
Best Case – Worst Case Analysis
But we also want to get an idea of the best case and worst-case scenarios have been in the asset. We refer to this as the best case versus worst case analysis.
To get an idea of the risk and reward we simply mark on the chart any rally and decline of 10% or greater. These values are the ranges between the low and the high price.
The following charts are helpful in distilling and defining the volatility of this asset.
Here is the best-case analysis which clearly shows that as a trading vehicle, $FL has had numerous rallies within its broader decline. Interestingly the most recent rally of 66.38% is the largest rally we have seen in this asset over the past year.
Next, we look at the declines in $FL over the same period to form our worst-case analysis. You can see that the declines in $FL are fast and furious. These drops occur in a 3 to 6-week time frame and illustrate how volatile this asset is.
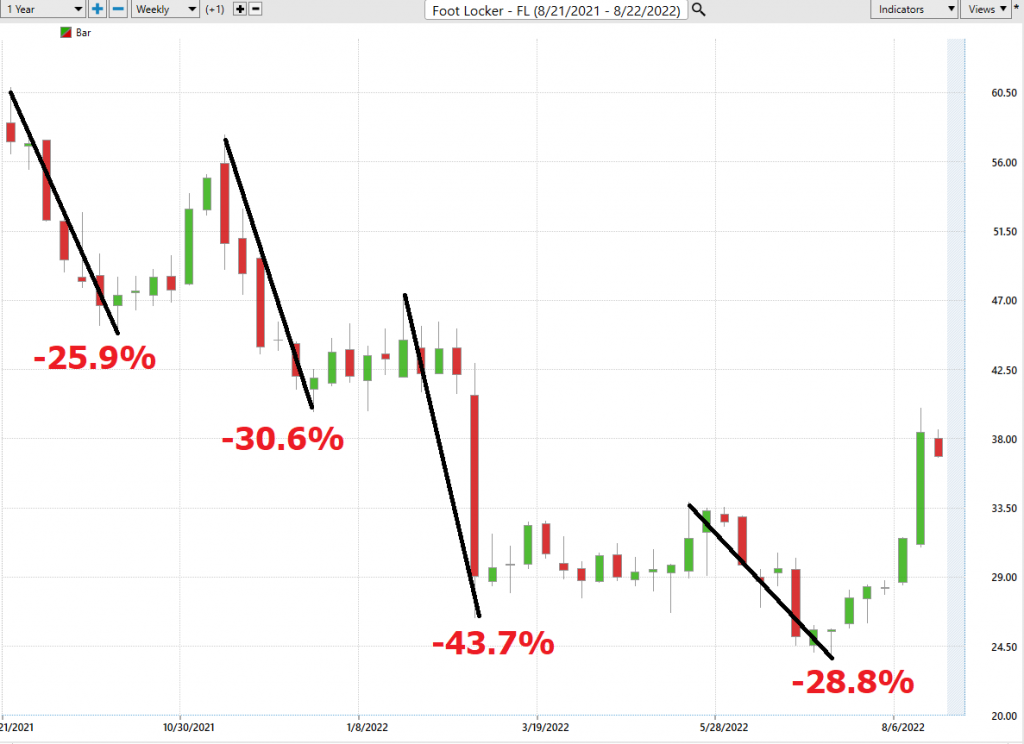
Takeaway: $FL is a trading vehicle and a wonder to behold. You can quickly see that ALL these percentages were accomplished within a period of a few weeks. The value of this type of analysis is that it provides a very realistic expectation of what you can expect moving forward. $FL is the type of asset that as a trader you will intuitively know if you are right or wrong should you choose to trade it.
The long and short of this analysis demonstrates that $FL is a hit and run trading candidate. This is because of how quickly it alters its directional bias.
Vantagepoint A.I. Forecast (Predictive Blue Line)
Let’s do some basic trend forecasting analysis based upon looking at the VantagePoint predictive blue line over the past 3 months. On the following chart you will see the power of the VantagePoint Predictive blue line which determines the medium term trend price forecast.
The guidelines we abide by are as follows:
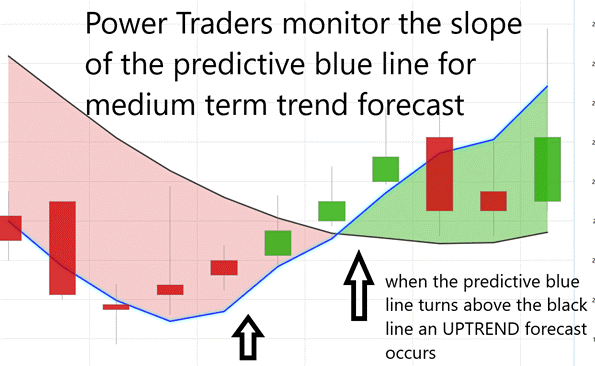
- The slope of the predictive blue line determines the trend and general direction of $FL
- When the blue line turns above the black line an UP opportunity occurs
- When the blue line turns below the black line a DOWN opportunity occurs
- Ideally, the VALUE ZONE is determined to try and buy the asset at or below the predictive blue line.
- The Up and Down Forecasts are isolated on the chart by the Green and Red Arrows along with the corresponding trading result.
This is the power and effectiveness of the Vantagepoint A.I. forecast in assisting traders to stay on the right side of the trend at the right time.
The predictive blue line is the initial indicator which Power Traders use to monitor and navigate the trend.
On the following chart you can see the maximum performance results in simply using the a.i. forecast to generate your trading opportunity.
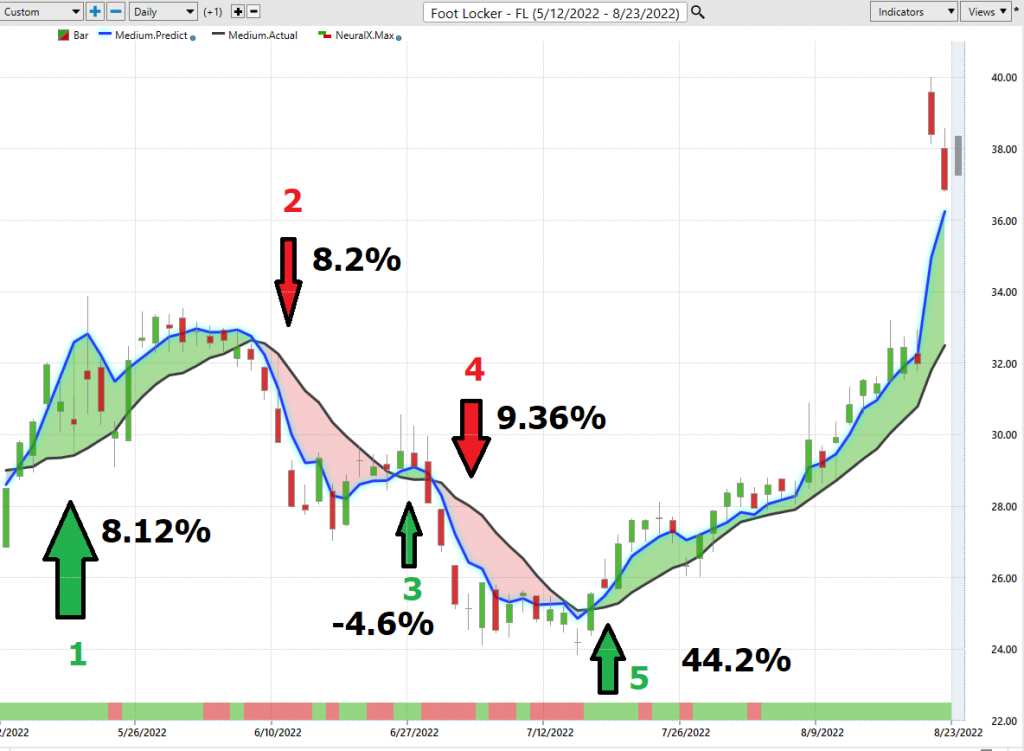
There are 5 trading opportunities:
#1 – Long for +8.12%
#2 – short for +8.2
#3 – long for -4.6% (losing trade)
#4 – short for +9.36%%
#5 – long for +44.2%
The maximum available gains on these 5 trading opportunities amounted to 65.28%. The average loss was -4.6%. The average gain has been 13.05%
Next traders cross-reference this signal with the historical pattern recognition available through machine learning.
Fine Tuning Entries with The Neural Net Indicator
At the bottom of the chart is the Neural Network Indicator which predicts future short-term strength and/or weakness in the market. When the Neural Net Indicator is green it communicates strength. When the Neural Net is red it is forecasting short term weakness in the market.
A neural network is a computing system that is modeled after the brain. neural networks are composed of input nodes, output nodes, and hidden nodes. Input nodes receive information from the outside world, while output nodes send information to the outside world. Hidden nodes are neither input nor output nodes; rather, they process information internally. neural networks learn by adjusting the weights of the connections between the nodes. The stronger the connection between two nodes, the more influential that connection is. Neural networks can be used for a variety of tasks, including pattern recognition and data classification.
At its essence, a Neural Net is a computational learning system that uses a network of functions to understand and translate massive amounts of data into a desired output, consistently monitoring itself and improving its performance.
Whenever Power Traders are looking for statistically valid trading setups, they look for a DOUBLE confirmation signal. This signal occurs whenever the blue predictive line and the Neural Net at the bottom of the chart suggest the same future expected outcome.
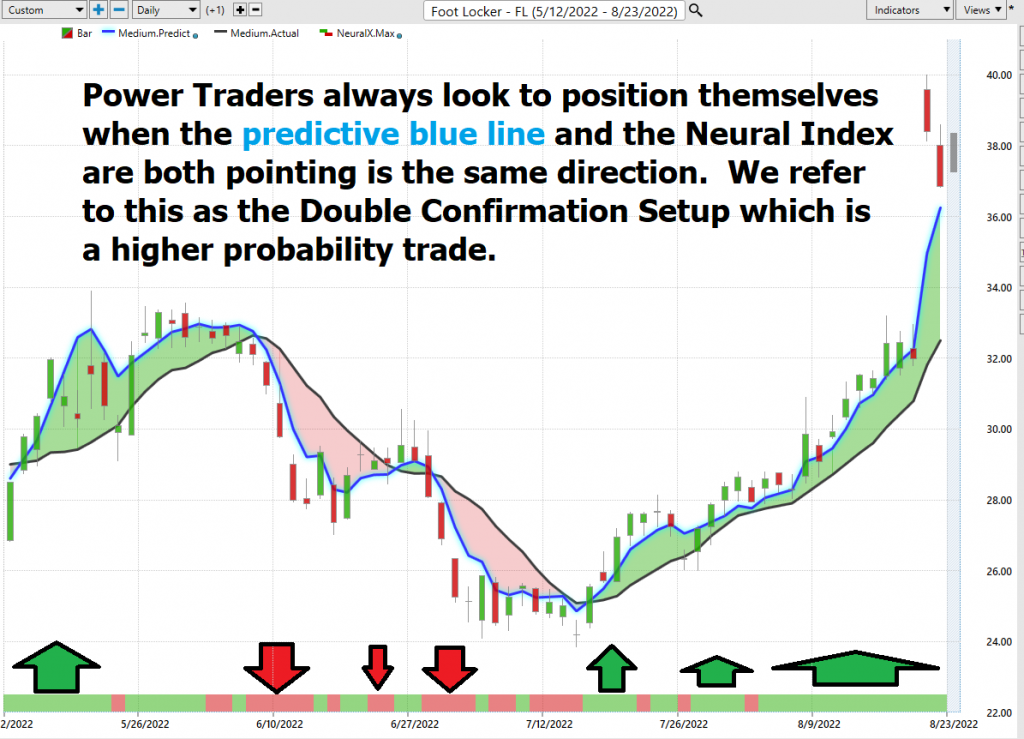
We advocate that Power Traders cross-reference the chart with the predictive blue line and neural network indicator to create optimal entry and exit points.
Traders look for confirmation on the Neural Net to position themselves for LONG or SHORT opportunities in the market. In other words, when the A.I. forecast is green, and The Neural Net is green, that presents a buying opportunity.
Power Traders are always looking to apply both the Neural Network and A.I. to the markets to find statistically sound trading opportunities.
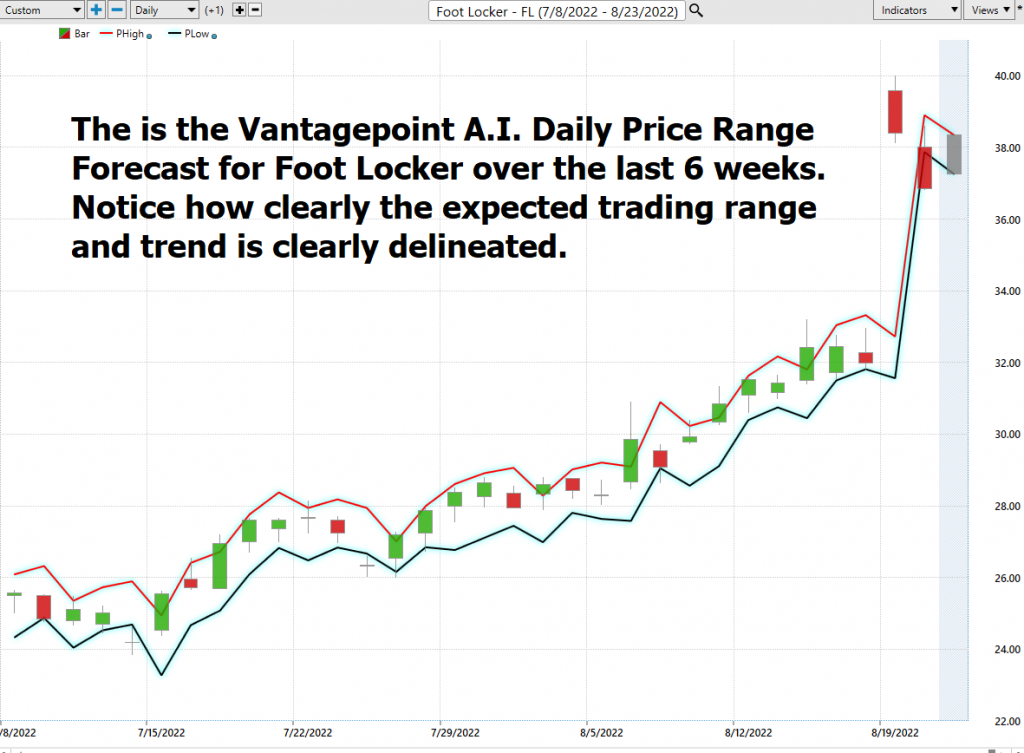
VantagePoint Software Daily Price Range Prediction
One of the powerful features in the VantagePoint Software which Power Traders use daily is the Price Range prediction forecast.
This forecast is what permits Power Traders to truly fine tune their entries and exits into the market.
Every day traders are faced with the anxiety and frustration of wondering where they should be looking for opportunities to buy and sell the market. VantagePoint’s A.I. makes this decision super easy with the Daily Price Range Forecast. This is where the rubber meets the road.
- Over the past year the average daily trading range for $FL has been $1.41.
- The average Weekly trading range has been $3.72.
- The average Monthly trading range has been $8.79.
The artificial intelligence along with the machine learning and neural networks incorporates pattern recognition, volume analysis and probability to determine the best move forward.
Here is the price chart of $FL during the most recent uptrend. The software very clearly delineates the daily forecast by providing an exact lower and upper boundary and delineates the trend.
Many factors can affect the daily price range of stocks, from global political events, earning reports, interest rates, weather, and headline news. As a result, forecasting the daily price range is a complex task that requires careful analysis.
There are several methods that can be used to forecast daily price ranges, including technical analysis, fundamental analysis, and news-based analysis. Technical analysis involves studying past price movements to identify patterns that may provide clues about future price behavior. Fundamental analysis focuses on economic indicators such as company earnings and interest rates. News-based analysis involves tracking breaking news stories that could have an impact on the stock market. Vantagepoint A.I. uses a proprietary algorithm that combines the power of a.i., neural networks and machine learning to provide a daily price range forecast. By using a combination of these methods, it is possible to develop a more accurate forecast of the daily stock market price range.
$FL is not for the faint of heart. As you study the daily range forecast notice how clearly the trend and trading range id delineated.
Machine learning is a subset of artificial intelligence that deals with the construction and study of algorithms that can learn from and make predictions on data. Neural networks are a type of machine learning algorithm that are used to model complex patterns in data. In the context of active trading, machine learning can be used to develop models that predict the likely trading range for the next day. These models are based on probability and game theory and consider a variety of factors such as past price movements, news events, and trader behavior. By analyzing a large dataset, machine learning algorithms can identify patterns that would be difficult for humans to discern. This information can then be used to make predictions about the best move forward in a given situation.
Active traders use A.I., neural networks and machine learning to define the next day’s trading range. By analyzing a large dataset, they can recognize patterns and make probability-based predictions about what the next day’s trading range will be. This information gives them an edge in making the best move forward.
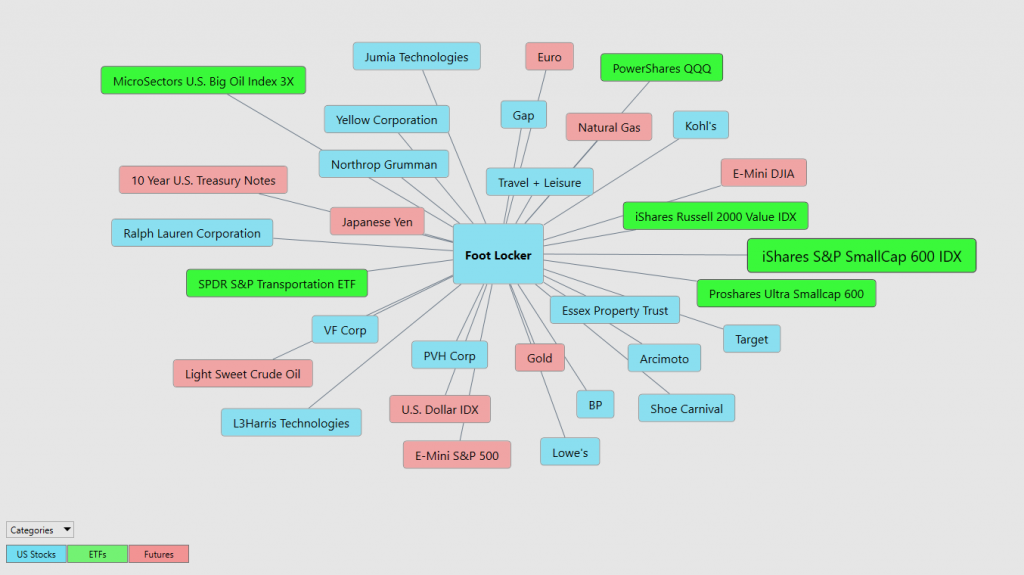
Intermarket Analysis
Power lies in the way we respond to the truth we understand.
One of the supremely important questions in trading is what is driving the price? Headlines often create interesting narratives. But these “stories” only capture the imagination. Traders want and need to understand the cause and effect of price movement.
The only way to get an answer to this important question is through Intermarket analysis which looks at statistical price correlations of assets.
Intermarket analysis is the study of relationships between different financial markets. It looks at how these markets affect each other, and how they can be used to predict future market movements. By understanding these relationships, traders can make informed decisions about where to allocate their capital. Intermarket analysis can be used to trade a variety of asset classes, including stocks, bonds, commodities, and currencies. There are several Intermarket indicators that can be used to identify opportunities, such as price correlations and momentum indicators. By taking the time to understand Intermarket dynamics, traders can give themselves a significant edge in the market.
So, a study of the relationship(s) will prove to be beneficial to a trader.
Interest rates, Crude Oil Prices, and the volatility of the Dollar amongst thousands of other variables affect the decisions companies must make to flourish and prosper in these challenging times. Trying to determine what these factors are is one of the huge problems facing investors and traders.
You always have a choice. You can tune in to the talking heads in the media who spin talking points which promote fear. Or you can rely on facts to base your decision making on.
Within the following Intermarket Analysis graphic, you will see the 31 markets that are the key drivers to $FL’s price.
Suggestion for Traders
When you look at the last few weeks $FL has moved UP 67% from its lows in a broader consolidating market environment. Initially, that appears quite impressive on the surface.
However, when you zoom out and look at $FL on a longer-term time frame you quickly recognize that this recent rally is the largest rally the stock has posted in the last two years. With current inventories 37% higher than this same time last year, and a slowing economy the fundamental expectations would be for $FL to contract. Earnings will be a key driver moving forward.
On August 18, 2022, $FL reported earnings of $1.10 per share when expectations were .80 cents per share. While this handily beat estimates, Wall Street is still overly concerned about inventories. Next earnings report is November 17, 2022, and expectations are for $1.14 per share. If $FL can hit that # clearly it will be on pace to match 2021 sales which were its highest in 20 years. If not, the expectation is that the stock and company will be forced to contract.
The Daily Range forecast and The Vantagepoint A.I. forecast will continue to be our guidance, and should we trade, it will be with a small allocation.
Our expectation is that the stock will pull back and present numerous short-term trading opportunities.
PUT $FL on your radar and allow the a.i. to guide your trading decisions.
Practice solid money management on all your trades.
We will re-evaluate based upon:
- New Wall Street Analysts’ Estimates
- New 52-week high and low boundaries
- Vantagepoint A.I. Forecast (Predictive Blue Line)
- Neural Network Forecast
- Daily Range Forecast
Let’s Be Careful Out There!
Remember, It’s Not Magic.
It’s Machine Learning.

IMPORTANT NOTICE!
THERE IS SUBSTANTIAL RISK OF LOSS ASSOCIATED WITH TRADING. ONLY RISK CAPITAL SHOULD BE USED TO TRADE. TRADING STOCKS, FUTURES, OPTIONS, FOREX, AND ETFs IS NOT SUITABLE FOR EVERYONE.
DISCLAIMER: STOCKS, FUTURES, OPTIONS, ETFs AND CURRENCY TRADING ALL HAVE LARGE POTENTIAL REWARDS, BUT THEY ALSO HAVE LARGE POTENTIAL RISK. YOU MUST BE AWARE OF THE RISKS AND BE WILLING TO ACCEPT THEM IN ORDER TO INVEST IN THESE MARKETS. DON’T TRADE WITH MONEY YOU CAN’T AFFORD TO LOSE. THIS ARTICLE AND WEBSITE IS NEITHER A SOLICITATION NOR AN OFFER TO BUY/SELL FUTURES, OPTIONS, STOCKS, OR CURRENCIES. NO REPRESENTATION IS BEING MADE THAT ANY ACCOUNT WILL OR IS LIKELY TO ACHIEVE PROFITS OR LOSSES SIMILAR TO THOSE DISCUSSED ON THIS ARTICLE OR WEBSITE. THE PAST PERFORMANCE OF ANY TRADING SYSTEM OR METHODOLOGY IS NOT NECESSARILY INDICATIVE OF FUTURE RESULTS. CFTC RULE 4.41 – HYPOTHETICAL OR SIMULATED PERFORMANCE RESULTS HAVE CERTAIN LIMITATIONS. UNLIKE AN ACTUAL PERFORMANCE RECORD, SIMULATED RESULTS DO NOT REPRESENT ACTUAL TRADING. ALSO, SINCE THE TRADES HAVE NOT BEEN EXECUTED, THE RESULTS MAY HAVE UNDER-OR-OVER COMPENSATED FOR THE IMPACT, IF ANY, OF CERTAIN MARKET FACTORS, SUCH AS LACK OF LIQUIDITY. SIMULATED TRADING PROGRAMS IN GENERAL ARE ALSO SUBJECT TO THE FACT THAT THEY ARE DESIGNED WITH THE BENEFIT OF HINDSIGHT. NO REPRESENTATION IS BEING MADE THAT ANY ACCOUNT WILL OR IS LIKELY TO ACHIEVE PROFIT OR LOSSES SIMILAR TO THOSE SHOWN.

