
![]()
Bed Bath and Beyond is an American company that was founded in 1971. It’s a retailer specializing in selling home goods, including items for the bedroom, bathroom, kitchen, and dining room. The company had 955 stores across the United States and employs approximately 55,000 people. In 2021, the company had gross revenue of $8.43 billion which was a 13.22% decline from 2020.
The last few years have been quite tumultuous for $BBBY. To put it bluntly the company has been bleeding money. The retailer has been trying desperately to remain relevant and has been lagging behind market leaders like Target and Walmart. Former CEO Mark Tritton, was brought in from Target in 2019 to turn around the ailing home furnishings company. Tritton closed half of the stores and fired half of the staff to make the company leaner and meaner. Comparable sales plunged 23% in its most recent quarter, and it reported an adjusted loss of $225 million.
On June 29, 2022, CEO Mark Tritton was fired by the Board of Directors for his failure in turning the ailing retailer around. The Board immediately began entertaining offers from Venture Capital firms looking to purchase the company at a deep discount to recent sales.
These losses have led Wall Street hedge funds to smell danger on the $BBBY balance sheet and they have come out in droves to actively short the stock. Short selling of a stock is when an investor sells a security they do not own and have borrowed from another party, with the hope that the price of the security will fall so they can buy it back at a lower price and return it to the lender. On Wall Street, the adage is buy low and sell high which people immediately understand. Professional traders often look to sell high and buy low in that sequential order. In other words, they borrow the stock first in the hopes they can p[ay it back in the future at a lower price.
The main reason people short sell stocks is because they believe the price is going to go down, allowing them to make a profit on the declining price. Although there are many benefits to short selling, there are also some risks involved. For example, if the price of the stock goes up instead of down, the investor will incur a loss. Short selling can be a risky move, but if done correctly, it can be very profitable. One of the biggest risks facing short sellers is a “short squeeze.”
A short squeeze occurs when a heavily shorted stock rapidly rises in price, forcing short sellers to cover their positions by buying the stock, leading to an even further price increase. This can happen when there is unexpectedly good news about the company, such as a positive earnings report, or when there are rumors of a potential takeover. Short squeezes can also be caused by bear traps. A bear trap occurs when investors who are betting that a stock will go down are forced to buy the stock at a higher price to avoid losses after the stock unexpectedly rises. This buying pressure can lead to an exponential price rise, which further perpetuates the short squeeze. Hedge funds are particularly susceptible to short squeezes because they often make large bets against stocks that they think are overvalued. When these stocks start to rise, the hedge funds are forced to buy them back at a loss, which can have a cascading effect and cause the stock to skyrocket.
For 13 of the last 14 sessions, the shares of $BBY have closed higher as the stock has rallied 338% from its lows. Much of the recent price action is remarkably like what occurred in GameStop ($GME) 20 months ago. Small speculators saw that the large hedge funds were massively short the stock anticipating a future bankruptcy. Small speculators in online trading forums create a “short squeeze” that has forced the hedge funds to buy back the shares they had sold, at much higher prices, leading to heavy losses. The price of $BBBY stock has exponentially risen as a result, causing hedge funds to lose millions of dollars.
In this weekly stock study, we will look at and analyze the following indicators and metrics as are our guidelines which dictate our behavior in deciding whether to buy, sell, or stand aside on a particular stock.
- Wall Street Analysts’ Estimates
- 52-week high and low boundaries
- Best Case – Worst Case Analysis
- Vantagepoint A.I. Forecast (Predictive Blue Line)
- Neural Network Forecast
- Daily Range Forecast
- Intermarket Analysis
- Our trading suggestion
We don’t base our decisions on things like earnings or fundamental cash flow valuations. However, we do look at them to better understand the financial landscape that a company is operating under.
Analysts Ratings
Based on 11 Best Performing Wall Street analysts offering 12-month price targets for Bed Bath & Beyond in the last 3 months. The average price target is $4.25 with a high forecast of $7.50 and a low forecast of $2.00. The average price target represents a -83.71% change from the last price of $26.09.
You can quickly see that from a pure fundamental point of view, $BBBY is massively overvalued and clearly the price action is a massive, short squeeze. Top Wall Street Analysts think the stock is fairly valued at $4.25 and it last traded at $26.09. When you witness situations like what is happening in $BBY you have to recognize that we are witness pure emotional greed at play between two opposing forces. Rationality is very much a very distant secondary factor.
52-week High-Low Chart
Looking at the Long-Term chart of $BBBY provides us with the 52-week high and low boundaries.
Over the past year we have seen $BBBY trade as low as $4.38 and as high as $30.14. This tells us that the average weekly trading range for $BBBY is $.50. This represents an annualized volatility of 104.5% which is exceedingly high. We calculate this base measurement of volatility by dividing the annual trading range by the most recent close.
The 52-week chart shows the wicked volatility that has taken place in $BBBY over the past year.
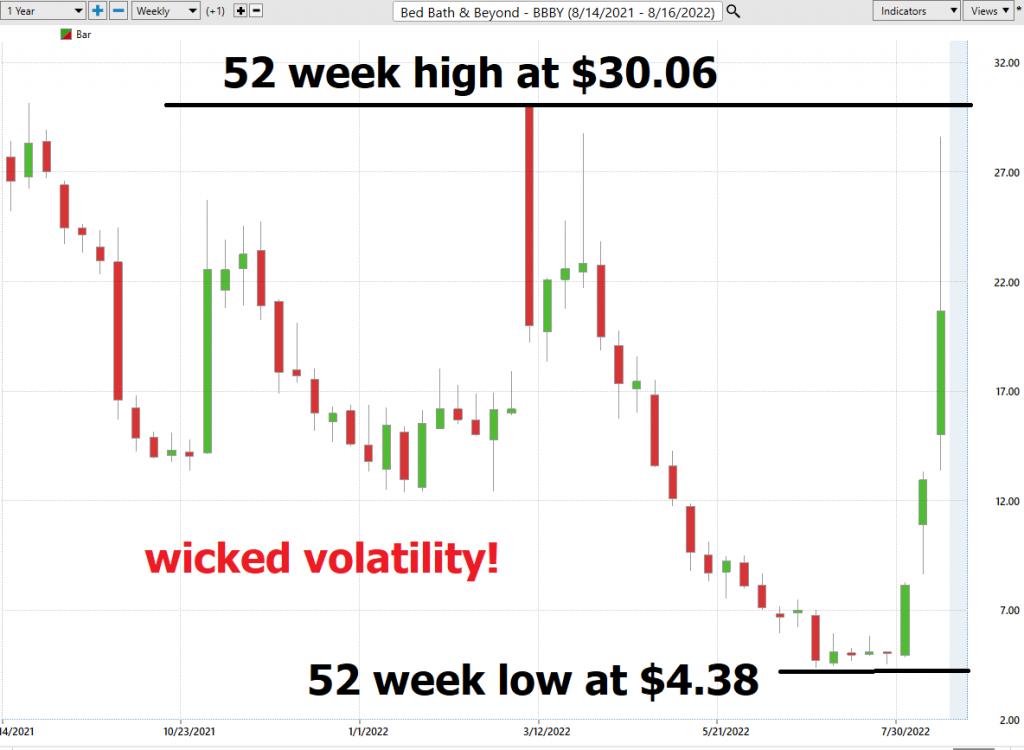
We like to study the 52-week chart before doing anything else just so that we can get a feel for how the company has performed over the past year and compare that to other opportunities and the broader market indexes.
Place these boundaries on your radar and pay attention.
When we face this kind of volatility, we also like to look at a longer-term time frame to see if we can discern any other viable trading tidbits.
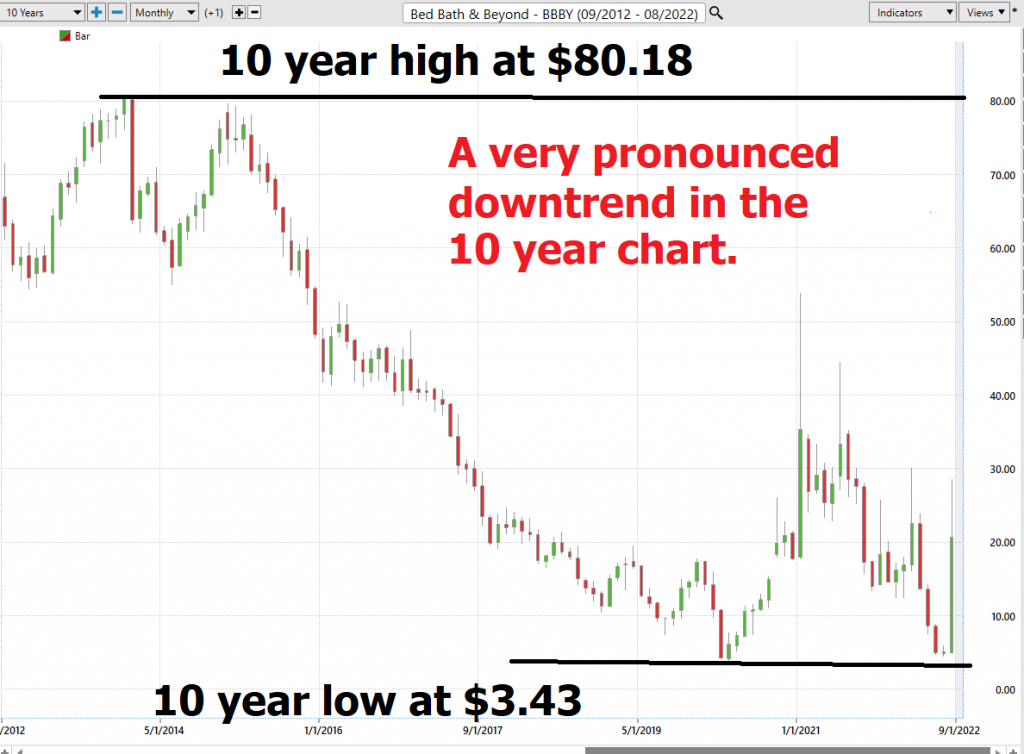
From a pure price action perspective, you can see how negative the trend has been on $BBBY.
Ignore the headline. Look at the price action and the charts and you will understand why the hedge funds added on to their massive, short upon the firing of CEO Mark Tritton a few months ago.
Best Case – Worst Case Analysis
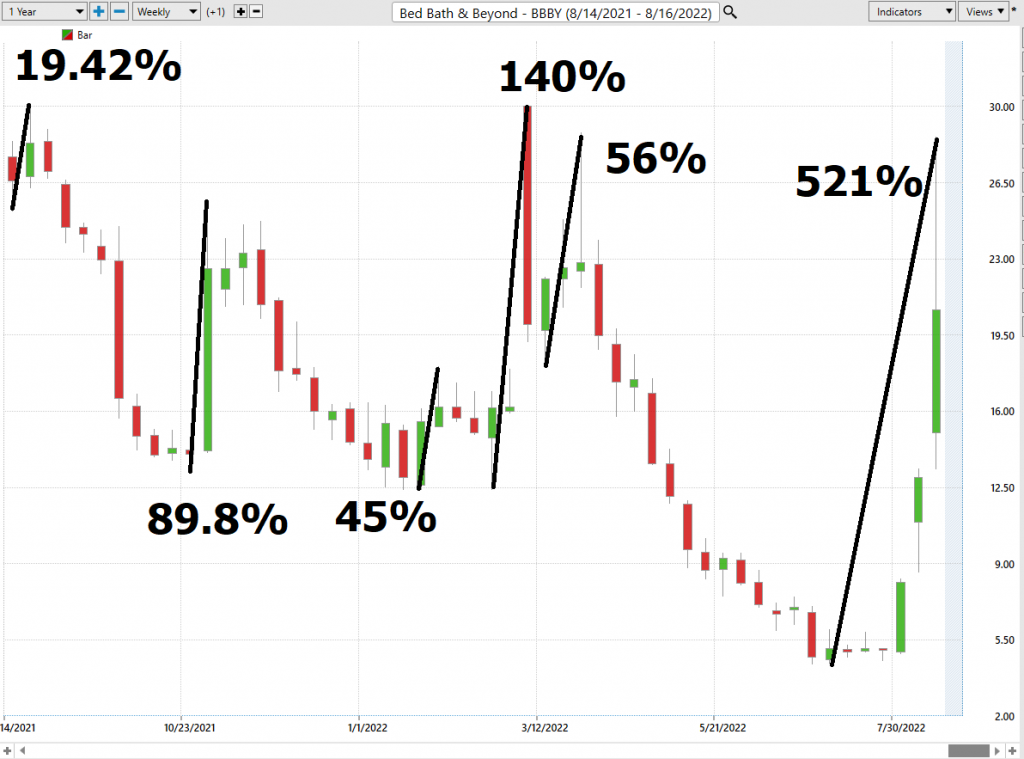
The chart below shows the numerous sharp declines that $BBBY had over the past year. The methodology is simply to connect the highest high to the most recent low without a violation of the trend. The purpose of this is to estimate and get a realistic expectation of the volatility of the stock.
By doing this we can quickly see how much the stock rallied.
We can see how long those gains held.
We can see how quickly the stock declined.
By letting the charts show the volatility we have very realistic expectations should we choose to trade this asset.
Here is the best-case scenario:
Here is the worst-case scenario:
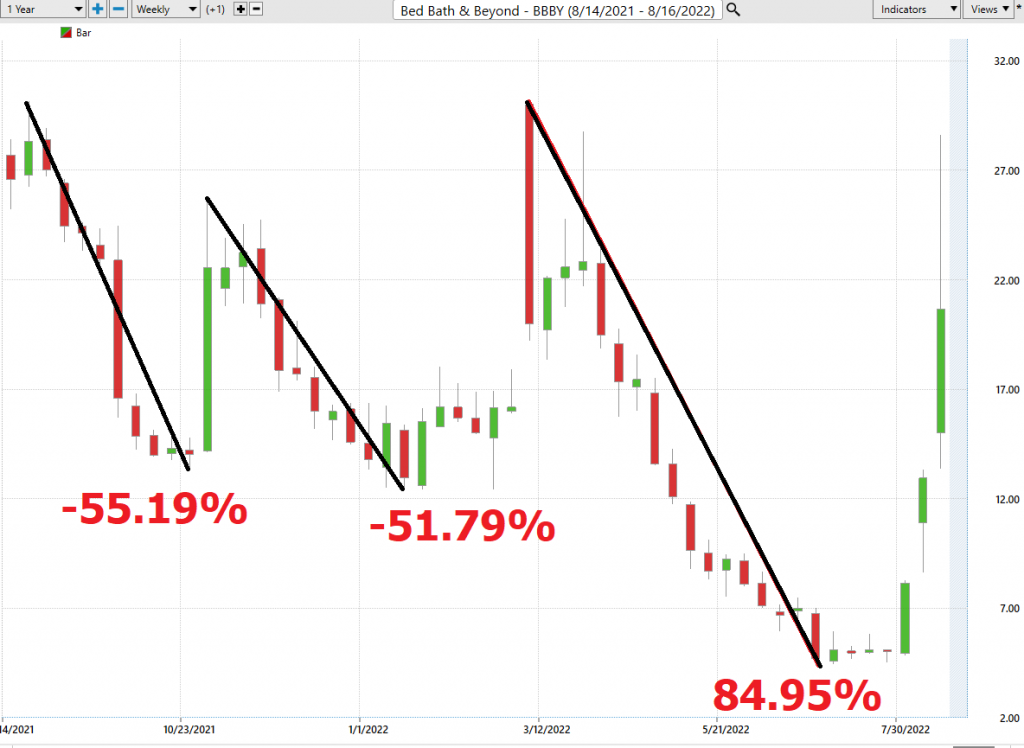
The very first thing we can tell is that the stock does not maintain its gains. Each candle is one week so $BBBY is not a buy and hold candidate by any means. Traders who choose to trade an asset know in advance that this stock because of its history over the past year is clearly a hit and run swing trading candidate.
This price volatility is ideal for SWING traders who can exploit the upside without having to experience the steep decline.
Next, we compare $BBBY to the performance of the broader stock market indexes.
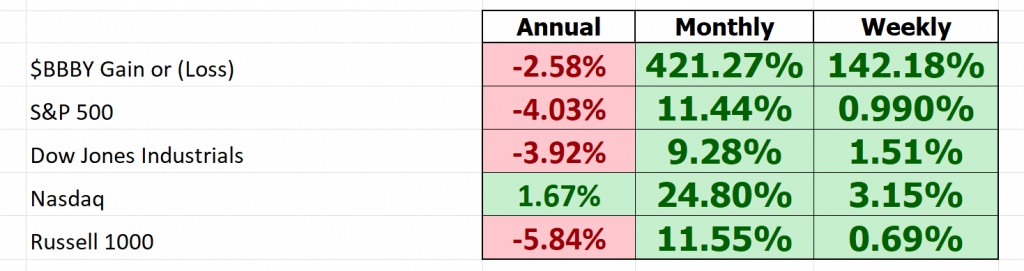
You can see that despite all of its short squeeze over the past few weeks it’s still down year over year. But the gains over the past week and month make it look extremely attractive compared to the stock indexes.
To get a better idea of competitiveness let’s look at $BBBY price action compared to the leading BIG Box retailers in the United States.
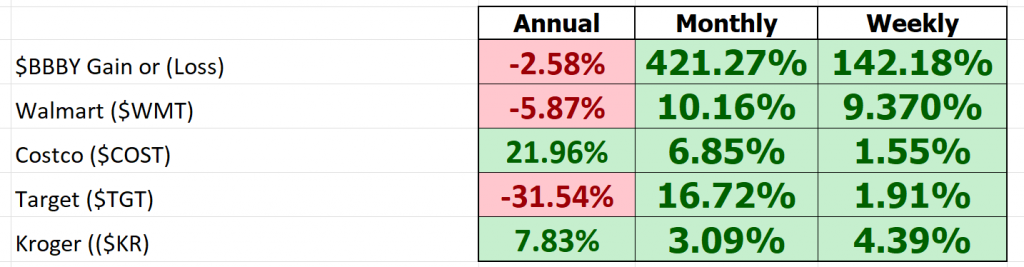
The “short squeeze” on the stock makes $BBBY look competitive, but we must keep in mind all of the gains in the stock took place in the past month. Had the short squeeze not unfolded $BBBY would clearly be at the bottom of the retailer list.
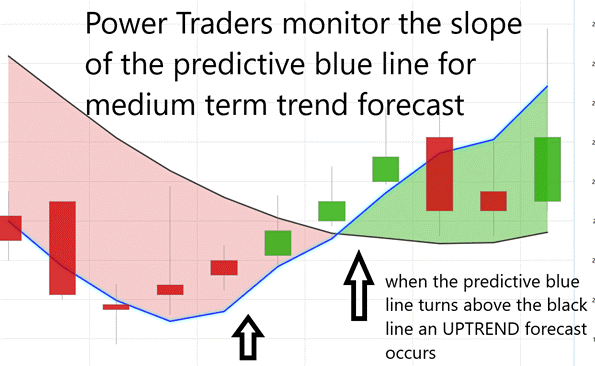
Vantagepoint A.I. Forecast (Predictive Blue Line)
The guidelines we abide by are as follows:
- The slope of the predictive blue line determines the trend and general direction of $BBBY
- Ideally, the VALUE ZONE is determined to try and buy the asset at or below the predictive blue line.
Here is a snapshot of the last years price action.
Let’s zoom in on the last several months of price action in Bed Bath and Beyond.
We featured $BBBY in our Vantagepoint A.I. Hot Stocks Outlook on
April 8, 2022, https://bit.ly/3Cebcmq
May 6, 2022, https://bit.ly/38X57xY
Both forecasts are available on YouTube where you can see how the a.i. embraced the volatility and traded long and short based upon the price action.
Here is the latest chart and Vantagepoint A.I. forecast. You can clearly see that the a.i. forecast changed on August 1, 2022, when $BBBY was trading at $5.77 a share.
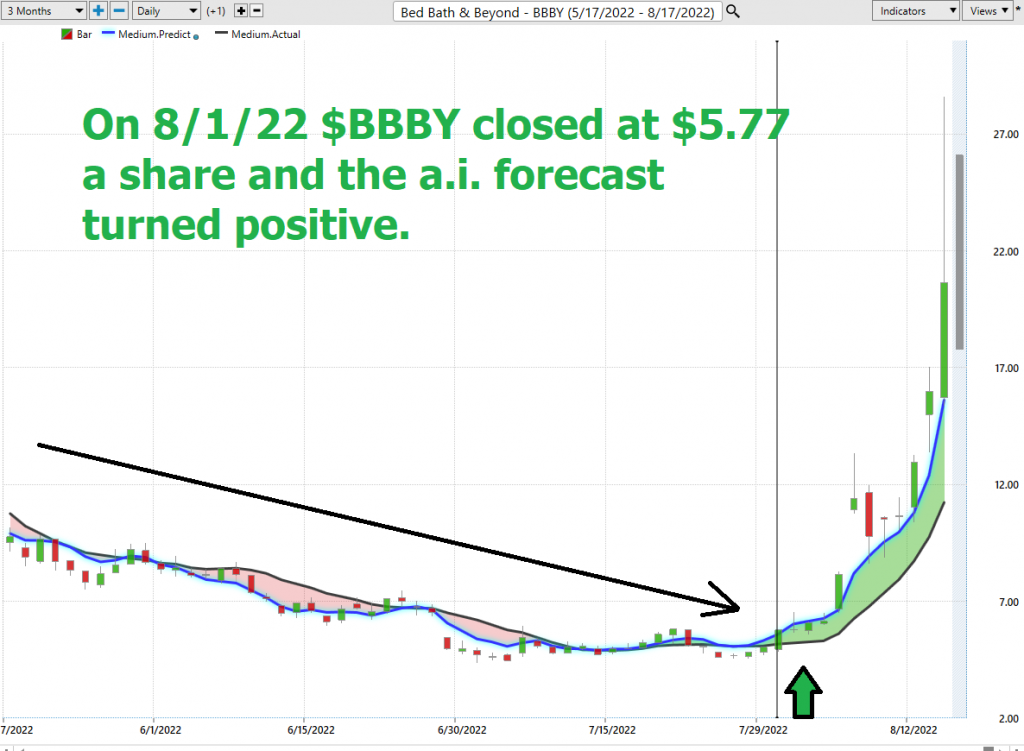
The green arrow on the chart highlights when price closed above the predictive blue line on 8/1/22.
Fine Tuning Entries with The Neural Net Indicator
At the bottom of the chart is the Neural Network Indicator which predicts future short-term strength and/or weakness in the market. When the Neural Net Indicator is green it communicates strength. When the Neural Net is red it is forecasting short term weakness in the market.
A Neural Net is a computational learning system that uses a network of functions to understand and translate massive amounts of data into a desired output, consistently monitoring itself and improving its performance.
Neural networks are a type of artificial intelligence that is used to generate price forecasts and make trading decisions. Neural networks analyze data using a set of algorithms that are designed to mimic the way the human brain processes information. Neural networks consider a variety of factors when making predictions, including price patterns, market trends, and the relationships between different assets. Once a neural network has been trained on historical data, it can generate price forecasts for future periods. Neural networks are often used to identify trading opportunities and to determine the most likely direction of price movement. Probabilities are also assigned to each price forecast, which allows traders to make informed decisions about their trades.
Whenever Power Traders are looking for statistically valid trading setups, they look for a DOUBLE confirmation signal. This signal occurs whenever the blue predictive line and the Neural Net at the bottom of the chart suggest the same future expected outcome.
We advocate that Power Traders cross reference the chart with the predictive blue line and neural network indicator to create optimal entry and exit points.
Traders look for confirmation on the Neural Net to position themselves LONG or SHORT in the market. In other words, when the A.I. forecast is green, and The Neural Net is green, that presents a buying opportunity.
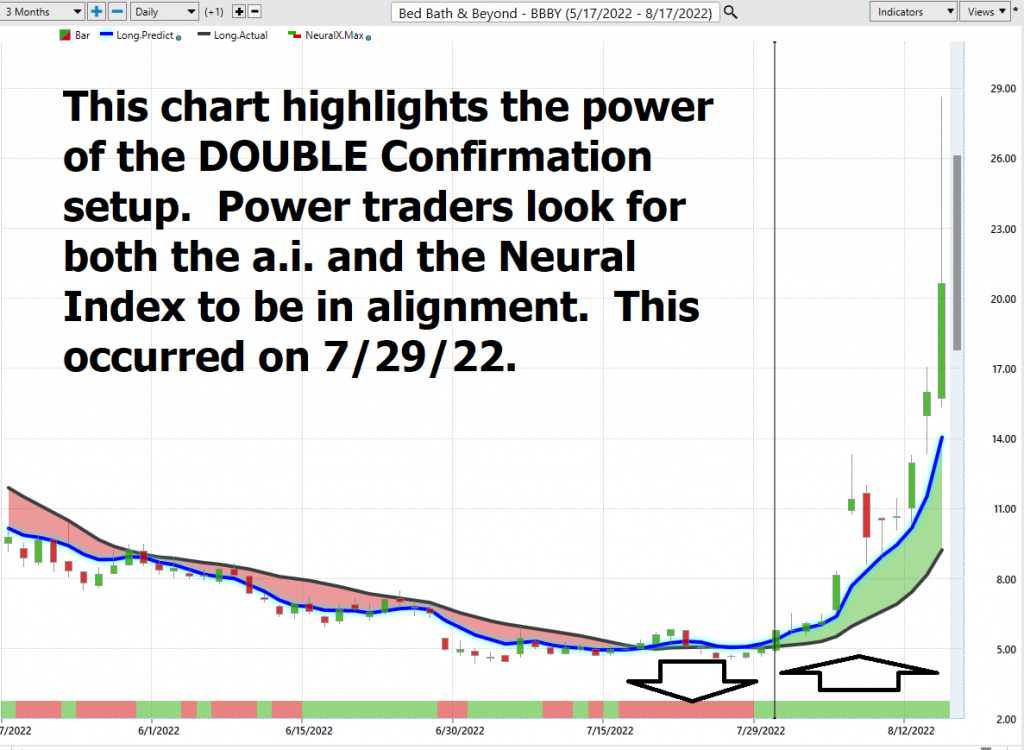
The inverse is also true, when the A.I. forecast is red and the Neural Net is red, that is a SELLING opportunity. The arrows on the chart below highlight the trading zones where Power Traders would’ve been using double confirmation to find a BUYING opportunity in cross referencing the A.I. forecast with the Neural Net.
Power Traders are always looking to apply both the Neural Network and A.I. to the markets to find statistically sound trading opportunities.
VantagePoint Software Daily Price Range Prediction
One of the powerful features in the VantagePoint Software which Power Traders use daily is the Price Range prediction forecast.
This forecast is what permits Power Traders to truly fine tune their entries and exits into the market.
Every day traders are faced with the anxiety and frustration of wondering where they should be looking to buy and sell the market. VantagePoint’s A.I. makes this decision super easy with the Daily Price Range Forecast.
For short term traders the important question that they have to confront every day is where should I buy? Where should I place my stop? Where should I sell? The VantagePoint Daily Price Range forecast can help them answer this question.
Price analysis is the process of identifying price patterns and using that information to make forecasts. Price patterns can be created by considering both price history and trading volume. There are many ways to analyze price patterns, but some common methods include the use of support and resistance levels, trendlines, price channels, and Fibonacci retracements. Once a price pattern has been identified, the software looks at its earlier history of forecasts to fine tune its process and decide about future price movements. These predictions are based on the idea that price patterns tend to repeat themselves over time. The use of price patterns recognition can give traders an edge in the market. By analyzing price data and making informed predictions, traders can increase their chances of making profitable trades.
Here is the price chart of $BBBY during the most recent one month.
Observe how the channel is very clearly delineated and it is very easy to observe where anticipated support and resistance over the short terms are. Traders look to buy near the bottom of the channel and sell at or above the top of the channel. Price normally has a tendency to quickly revert back into the channel when outlier days occur.
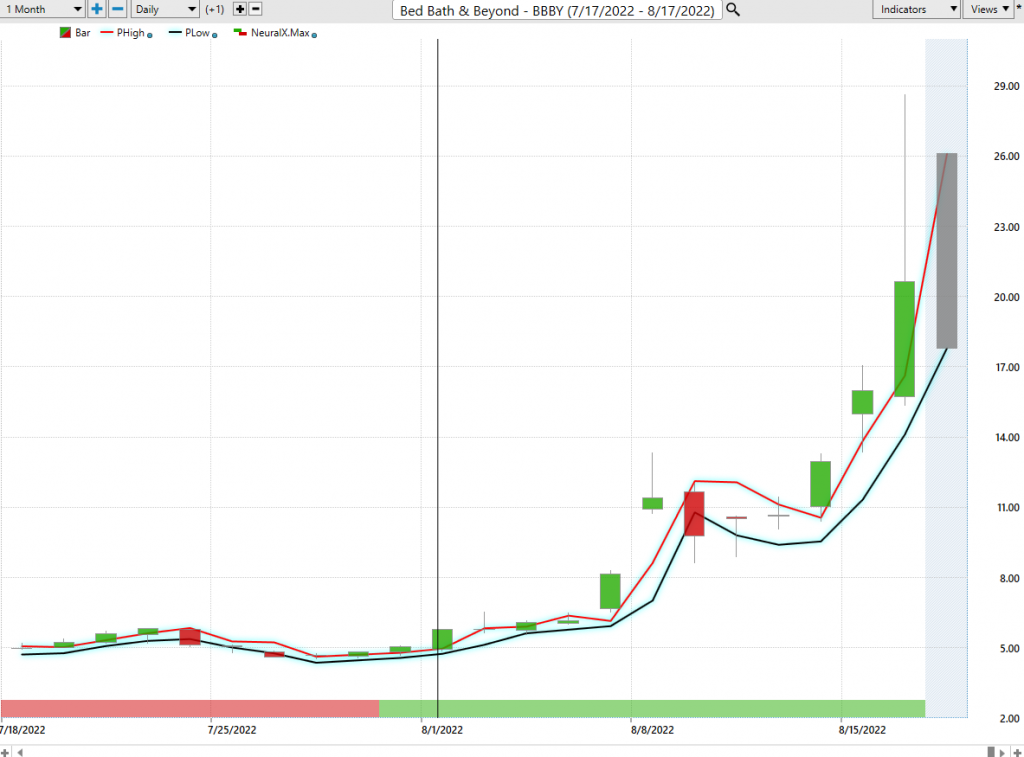
See how the upper and lower bands of the price range forecast form a noticeably clear channel of trading activity as well. Swing traders are always looking for opportunities to buy towards the bottom of the predicted channel and selling opportunities above the top band.
Intermarket Analysis
Power lies in the way we respond to the truth we understand.
One of the supremely important questions in trading is what is driving the price? Headlines often create interesting narratives. But these “stories” only capture the imagination. Traders want and need to understand the cause and effect of price movement.
The only way to get an answer to this important question is through intermarket analysis which looks at statistical price correlations of assets.
We live in a global marketplace.
Everything is interconnected.
Intermarket analysis is a trading analysis technique that looks at the correlation between different asset classes in order to make better-informed trading decisions. By considering the relationships between different markets, intermarket analysis can give traders a more complete picture of the overall market environment.
For example, by analyzing the relationship between $BBBY and other markets, traders can get a better sense of whether the market is bullish or bearish. By looking at the correlation between $BBBY and crude oil, traders can get a better sense of which way prices are likely to move. By considering these and other relationships, intermarket analysis can help traders to make more informed trading decisions.
Traders use correlation and intermarket analysis in their decision-making process to take advantage of expected price movements in different markets. By understanding the relationships between asset classes, traders can identify opportunities that are less exposed to overall market risk. Furthermore, by analyzing correlations, traders can adjust their portfolios to capitalize on changing market conditions and reduce exposure to potential losses. In summary, correlation and intermarket analysis are important tools that help hedge fund managers make informed investment decisions.
Interest rates, Crude Oil Prices, and the volatility of the Dollar amongst thousands of other variables affect the decisions companies must make to flourish and prosper in these challenging times. Trying to determine what these factors are is one of the huge problems facing investors and traders.
You always have a choice. You can tune in to the talking heads in the media who spin talking points which promote fear. Or you can rely on facts to base your decision making on.
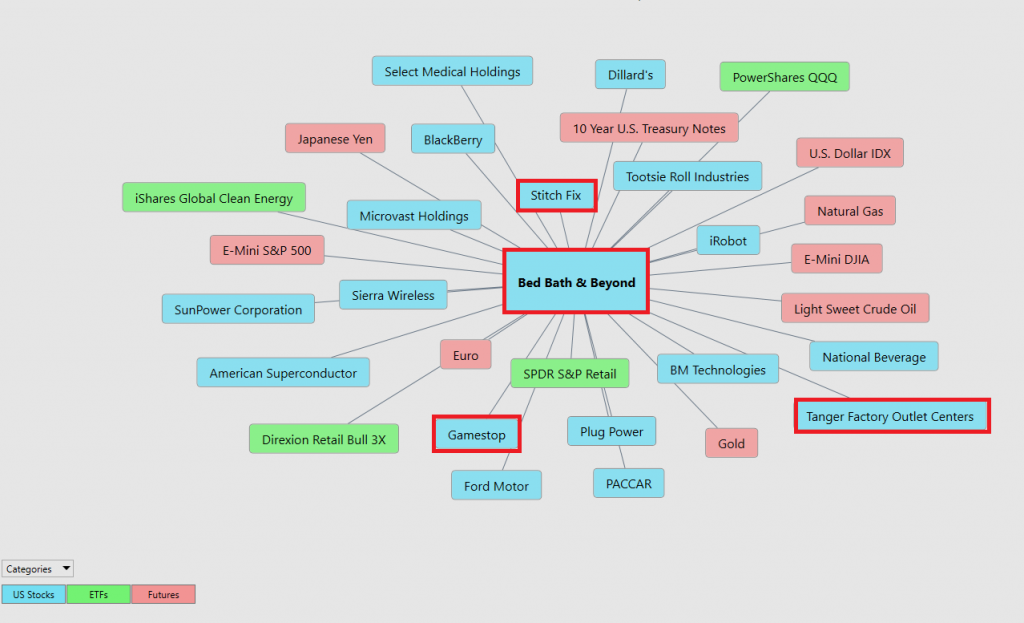
There is immense value to be had in studying and understanding the key drivers of $BBBY’s price action. This graphic provides a microcosmic view of what factors have been driving $BBBY’s price higher.
I have taken the liberty of highlighting in RED the other markets that $BBBY is highly correlated with.
Suggestion for Traders
$BBBY has been grabbing headline news lately because it is repeating the short squeeze that happened in GameStop ($GME) 20 months ago.
In this analysis we have highlighted upon history, price action, volatility to demonstrate how all these concepts have a place in a trader’s decision-making process.
Price action, volatility and trend analysis are all important factors to consider when making trading decisions. By studying price action, traders can better understand the dynamics of the market and identify potential trading opportunities.
Volatility is another important factor to consider, as it impacts the risk and reward of a trade. By understanding how volatility affects price movement, traders can make more informed decisions about when to enter and exit a trade.
Finally, trend analysis can help traders identify potential trend reversals and make better-informed decisions about where to place their stop-losses and take-profits. By taking all these factors into account, traders can improve their decision-making process and increase their chances of success.
We think that $BBBY is overvalued. The trend is UP according to the most recent a.i. price action. But on the other side Wall Street analysts see the fundamental value of the company is around $4.57 a share. This represents about an 85% fall from current levels.
Lastly, we might be premature, but the risk versus reward on this asset, at present time is massive.
Seasoned traders can find short term swing trading opportunities within the channel. But this is a volatile high-risk asset at the present time and not suited for investors or new traders.
Also pay attention to the 52-week high which we think will pose great resistance to the current trend.
Our recommendation is to follow the A.I. trend analysis as outlined in this stock study and practice good money management on all trades.
We will re-evaluate this analysis based upon:
- Wall Street Analysts’ Estimates
- 52-week high and low boundaries
- Vantagepoint A.I. Forecast (Predictive Blue Line)
- Neural Network Forecast
- Daily Range Forecast
- Intermarket Analysis
Let’s Be Careful Out There!
Remember, It’s Not Magic.
It’s Machine Learning.

IMPORTANT NOTICE!
THERE IS SUBSTANTIAL RISK OF LOSS ASSOCIATED WITH TRADING. ONLY RISK CAPITAL SHOULD BE USED TO TRADE. TRADING STOCKS, FUTURES, OPTIONS, FOREX, AND ETFs IS NOT SUITABLE FOR EVERYONE.
DISCLAIMER: STOCKS, FUTURES, OPTIONS, ETFs AND CURRENCY TRADING ALL HAVE LARGE POTENTIAL REWARDS, BUT THEY ALSO HAVE LARGE POTENTIAL RISK. YOU MUST BE AWARE OF THE RISKS AND BE WILLING TO ACCEPT THEM IN ORDER TO INVEST IN THESE MARKETS. DON’T TRADE WITH MONEY YOU CAN’T AFFORD TO LOSE. THIS ARTICLE AND WEBSITE IS NEITHER A SOLICITATION NOR AN OFFER TO BUY/SELL FUTURES, OPTIONS, STOCKS, OR CURRENCIES. NO REPRESENTATION IS BEING MADE THAT ANY ACCOUNT WILL OR IS LIKELY TO ACHIEVE PROFITS OR LOSSES SIMILAR TO THOSE DISCUSSED ON THIS ARTICLE OR WEBSITE. THE PAST PERFORMANCE OF ANY TRADING SYSTEM OR METHODOLOGY IS NOT NECESSARILY INDICATIVE OF FUTURE RESULTS. CFTC RULE 4.41 – HYPOTHETICAL OR SIMULATED PERFORMANCE RESULTS HAVE CERTAIN LIMITATIONS. UNLIKE AN ACTUAL PERFORMANCE RECORD, SIMULATED RESULTS DO NOT REPRESENT ACTUAL TRADING. ALSO, SINCE THE TRADES HAVE NOT BEEN EXECUTED, THE RESULTS MAY HAVE UNDER-OR-OVER COMPENSATED FOR THE IMPACT, IF ANY, OF CERTAIN MARKET FACTORS, SUCH AS LACK OF LIQUIDITY. SIMULATED TRADING PROGRAMS IN GENERAL ARE ALSO SUBJECT TO THE FACT THAT THEY ARE DESIGNED WITH THE BENEFIT OF HINDSIGHT. NO REPRESENTATION IS BEING MADE THAT ANY ACCOUNT WILL OR IS LIKELY TO ACHIEVE PROFIT OR LOSSES SIMILAR TO THOSE SHOWN.

