
I have been very perplexed over the past week whenever I look at the economic data reported by the government. Whenever I feel bamboozled I always return to the basics to see if I can make sense of the supply and demand fundamentals that drive market activity.
When I look at the economy, I contend we have been in a recession for the last 5 months. I can demonstrate this with a handful of charts recognizing that my opinion and interpretation of these charts is very much out of favor.
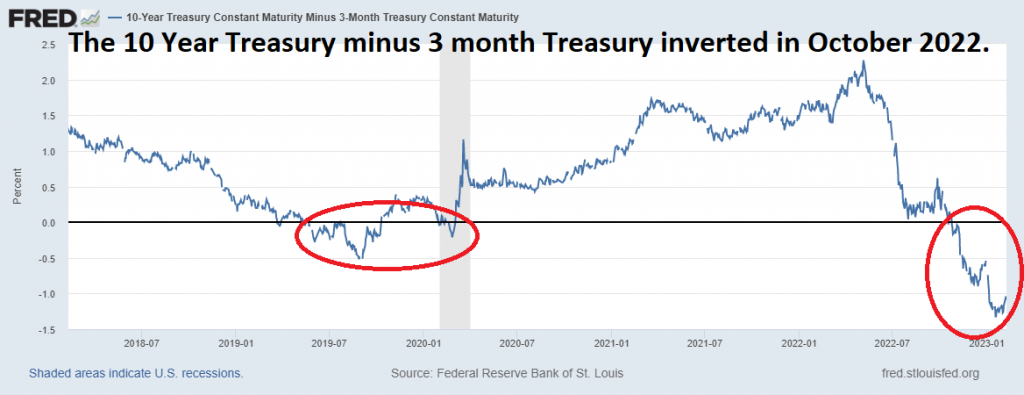
First off, the YIELD CURVE. The yield curve is an important economic indicator that reflects the relationship between short-term and long-term debt securities. It’s typically represented by a graph with the x-axis showing different debt maturities, and the y-axis representing corresponding interest rates for those debt instruments. The shape of the graph can show investors where market conditions are currently at, and which direction they could be heading in. Economists consider the 10-year Treasury Note minus the 3-month Treasury bill an effective barometer and measurement for a recession because it reflects the market’s expectations of long-term economic growth versus short-term economic health. This statistic, called the yield curve, accurately depicts when economic conditions are in flux due to a decrease or inverted yield spread between both Treasury instruments. When the yield curve inverts it communicates that investors see great risk over the long term and require a higher percentage return to lock up their money in a Treasury instrument. Historically speaking, when this spread has been negative its preceded every recession since 1970, with only one false positive result in 1998. It’s also worth noting that since 2008, three consecutive months of an inverted yield spread has been indicative of all five recessions that have occurred in the past 12 years. This makes the 10-year Treasury Note – 3-month Treasury bill barometer highly accurate and reliable as an effective tool to predict looming recessions and guide policy decisions accordingly.
A recession is traditionally defined as a period of economic decline that generally lasts more than a few months, commonly defined in mainstream economics as two consecutive quarters of declining GDP. During a recession GDP growth slows down or even contracts, leading to rising unemployment, reduced consumer spending, decreased business investment and other negative economic impacts. All these factors can lead to long-term consequences on society as well as the economy, such as increased costs of living or an increase in public debt. It can take years for an economy to recover from a severe recession so governments typically enact fiscal and monetary policies to help cushion the negative impact and engineer an economic recovery.
Below is the chart of GDP growth in the United States for 2020 to 2022. You can clearly see the slowing growth rate which has unfolded since July 2021.
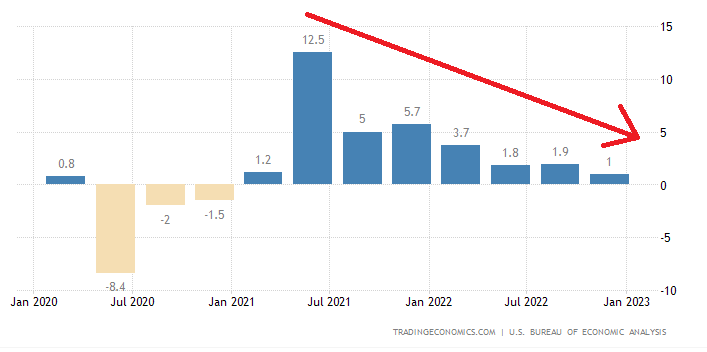
source: tradingeconomics.com
According to the Conference Board, global real GDP is forecasted to grow by 2.2% in 2023, down from 3.2% in 2022. Those two charts by themselves fulfill the definition of a recession.
But there are two more troublesome charts which in my mind cannot be ignored.
Look at the following chart of M2 Money Supply. For the first time in 65 years, it has contracted on an annual basis!
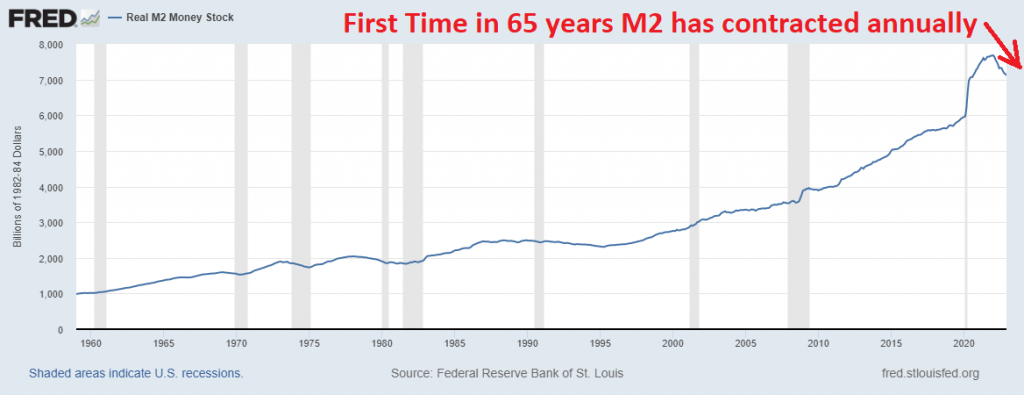
When M2 money supply contracts on a year over year basis, it is usually an indication of economic weakness in the economy. This type of data can be seen as a warning sign for consumers and businesses about sluggishness in spending or lending that could lead to slower economic growth in the future. In many cases, when M2 money supply contracts, it signals a need for monetary measures such as quantitative easing from central banks designed to stimulate the economy back onto a path of growth. Ultimately, it is important to closely monitor M2 Money Supply data as contraction on a year over year basis can have broad implications that affect businesses and consumers throughout the economy.
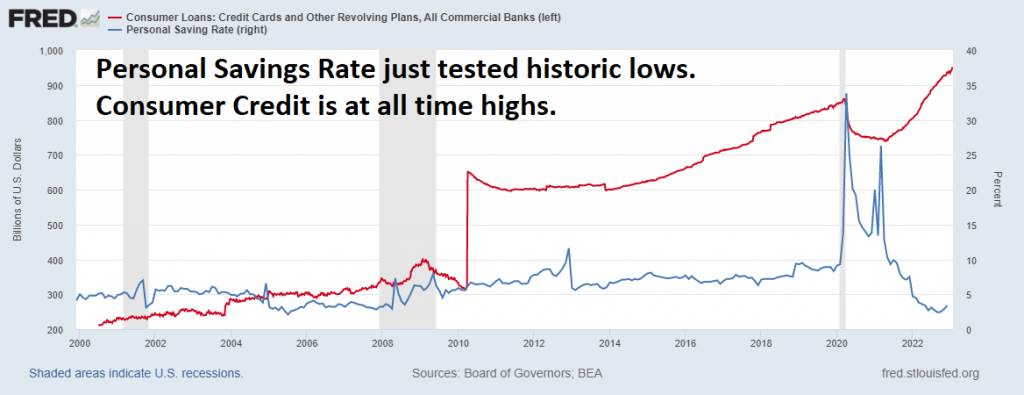
Lastly, check out the Federal Reserve chart which compares Personal Savings Rate to Outstanding Consumer Loans.
When I put these charts together to form a cohesive narrative of what is occurring in the economy, I see the following:
- The YIELD CURVE is saying RISK is pronounced over the short term.
- Money Supply contraction is a sluggish anomaly we have never seen in the economy on a year over year basis.
- Consumer Credit is at all-time highs which means the average individual is tapping out their credit cards.
- The Personal savings rate has been testing all-time lows.
I can’t create a positive spin on this regardless of how hard I try.
Any of the charts in and of themselves paint a potentially scary picture. The Fed is tightening and raising interest rates into a sluggish economy.
But then last Friday, February 3rd, the U.S. Jobs Report was released, and it was reported that the economy added 517,000 new jobs.
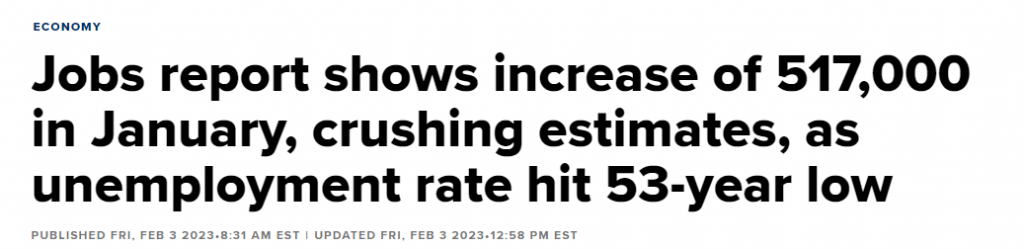
The report showed that the jobs market is the strongest it has ever been since May 1969 with an unemployment rate of only 3.4%.
This is a complete headscratcher.
HOW?
Over the past six months BIG TECH has been laying off people at a record pace.
Google laid off 6% of its employees.
Meta laid off 12% of its workforce.
Microsoft laid off 5% of its workforce.
Amazon laid off 5% of its workforce.
Salesforce laid off 10% of its workforce.
Uber laid off 14% of its workforce.
Dell laid off 5% of its workforce.
Zoom laid off 10% of their workforce.
Cisco laid off 5% of its workforce.
IBM laid off 2% of its workforce.
Zillow and Airbnb laid off 25% of their workforces.
You can check out the casualties at layoffs.fyi
Regardless how hard I try I can’t understand how big tech is suffering and laying off its workforce, while the jobs report is claiming we have the lowest and best unemployment rate since May 1969. Something is not right.
It’s a PUZZLE that I am incapable of comprehending.
Throughout all of 2022, the Federal Reserve raised interest rates at the fastest pace in history. This reality has forced the government, businesses and individuals to completely re-evaluate their finances entirely. Yet, in spite of this rapid increase in the interest rate, we are told the jobs market is the healthiest it has been in 53 years.
How can the largest employers in the country be displacing people at a record pace while the jobs report is claiming we have the best employment market since 1969?
It makes zero sense.
What has me most worried at present time is the health of the real estate market and the effect that the rising interest rates will have on real estate and also servicing the interest on the national debt.
Let me explain.
Over the last 42 years the one SUPERTREND that drove the economy forward was lower interest rates. This is something that was completely taken for granted in economic thinking.
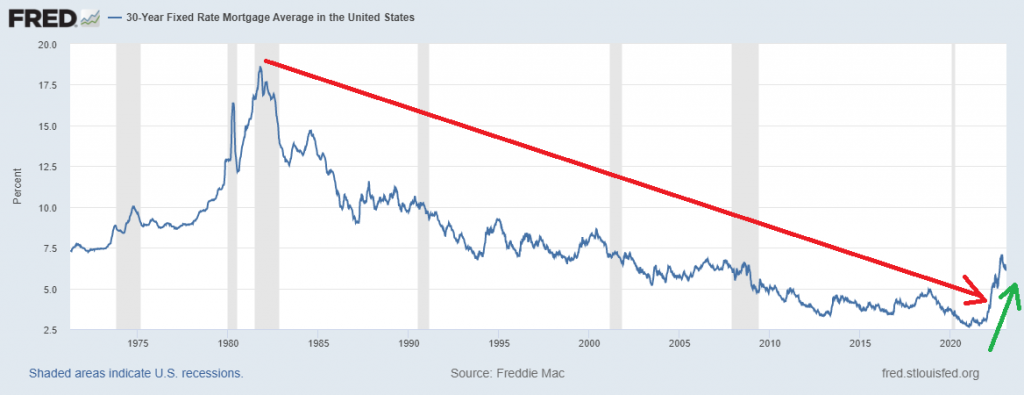
Lower interest rates meant that homeowners could refinance their houses to get lower monthly payments or upgrade to a higher priced home for the same monthly payment since interest rates were falling.
Homeowners learned how to make their home their personal ATM. Lower interest rates meant perpetual refinancing to create positive cash flow from an existing asset.
But that reality has all ended in 2022.
The simplest way of understanding this is to evaluate a simple mortgage amortization schedule and compare the cost and monthly payment to acquire a home in 2021 versus today.
In 2021 mortgage rates were around 2.7%
As of this writing, the current mortgage rate is roughly 7% on a 30 year fixed rate.
Here is the difference in what this change in interest rates means to the average homebuyer.
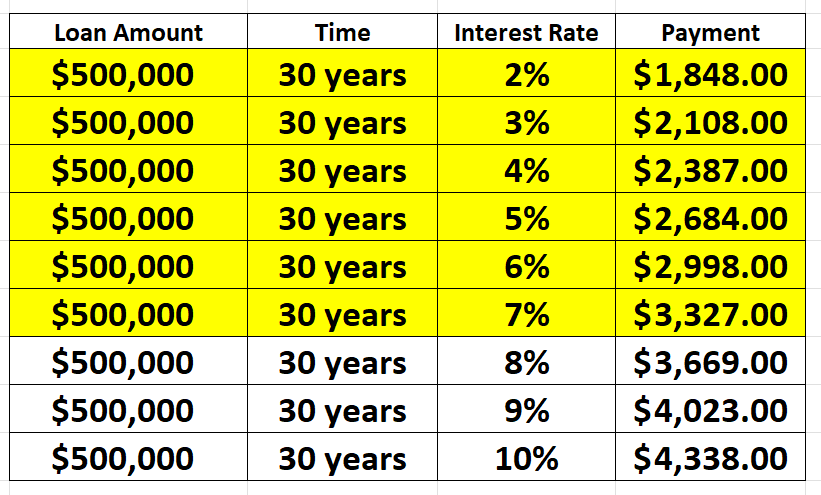
The point is rising interest rates create an affordability problem. In 2021 a 3% 30 year fixed rate mortgage on a $500,000 home was $2,108. Today that exact same mortgage is 57.8% more expensive as it costs $3,327.
This is not a minor detail in terms of assessing real estate valuations. Instead of using your home as your personal ATM, a homeowner today has to be more concerned with whether his real estate will hold its value over the term of his ownership.
Now look at it from a MACRO point of view.
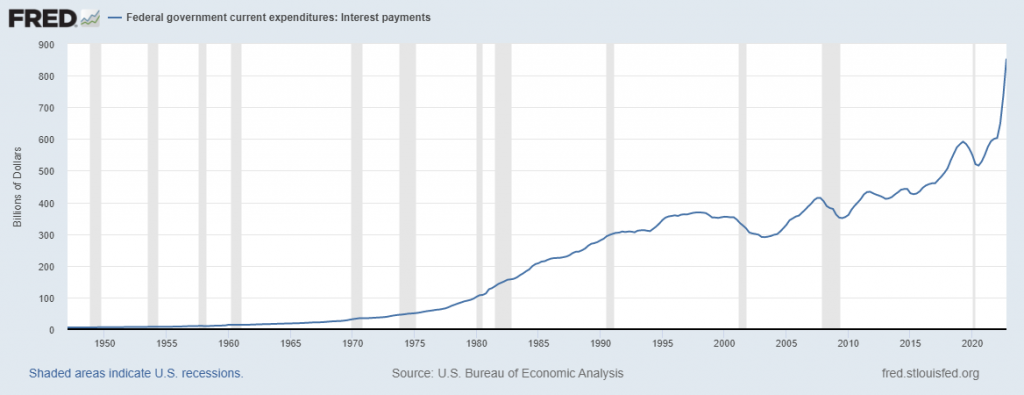
The government has refinanced the entirety of the $32 trillion dollars’ worth of the national debt at roughly 2.25%. Rates are currently more than 50% higher as the 10 year note is yielding 3.63%. The consequences of the higher interest rates means that moving forward more money will be required to pay the interest on the debt.
Look at the following chart from the Federal Reserve Bank of St. Louis which shows interest rate payments. The chart has literally gone vertical.
Where does that additional money to service the debt come from?
The final figure shows that the government paid $853 billion in interest in Q4 of 2022. Now with interest rates 50% higher than they were a year ago I can’t fathom how this is a positive sign for the economy overall.
At the start of the pandemic the interest expense was $528 billion. In 3 years, interest expense has grown 65%!
Higher taxes end up being a burden on the economy.
Historically the answer is that governments always choose is to debase the currency.
My conclusion is that when mainstream economists confess that we are in a recession that it is going to be worse than previous recessions.
The Great Recession of 2008 was the worst recession the United States has ever seen. It was caused largely by a housing market crash and lenders taking on too much risk. It lasted from late 2007 to mid-2009, threw millions out of work, forced thousands of businesses to close their doors, and left many families without a home. By some estimates, it erased almost $7 trillion from net worths in the U.S., illustrating the devastating effects it had on people’s standards of living and wealth. Additionally, it sparked an economic crisis in many other countries around the world, with long-lasting effects that are still being felt in the modern day economy.
I hope that I’m wrong!
As I always mention in these articles, I work very diligently to try and understand the fundamental factors of the economy. But I never let them get in the way of my trading decisions. This is why I use artificial intelligence to help improve my decision making process.
The markets at this time completely disagree with my economic analysis. I understand that.
Put simply, markets are discounting mechanisms. This means they are reacting to current information in order to determine the expected future value of an asset or economy. Markets will weigh information they are given such as industry trends, economic indicators and even sentiment and use it to accurately establish real-time pricing of products and services. In other words, markets can discount a company’s future results based on the available information they have in the present. This is why markets tend to fluctuate wildly with changing expectations or news; they are proactively trying to calculate the fair price of an asset or commodity based off of their existing understanding of the situation.
In today’s world, this is why artificial intelligence is indispensable to a trader. Because good trading is all about timing.
Artificial intelligence, machine learning, and neural networks have revolutionized the trading industry. These technologies can provide traders with deep insights into market trends and help them identify patterns in order to predict future movement of asset prices. AI can also be used to analyze news articles quickly in order to get an immediate understanding of any economic or political event that could affect markets, helping traders take swift and informed decisions. Thanks to their accurate modeling capabilities, AI tools can accurately assess risk levels, allowing traders to evaluate potential losses and adjust their strategies accordingly. Ultimately, A.I.-based methods provide traders with a powerful arsenal of tools that help them make faster and smarter trading decisions.
With the capacity to quickly crunch large amounts of data, A.I. technology can provide accurate and in-depth insight into market trends and financial conditions. Furthermore, as neural networks are able to ‘learn’ from previous data inputs thousands of times faster than a human being can process it, they can detect patterns that may not be tangible to the average trader. Not only this, but they have the ability to identify correlations between elements that could predict future outcomes with greater accuracy than ever before. In short, these technologies offer advanced analytics to the trading world which in turn means more intelligent decisions made by traders – a prospect sure to appeal to any investor.
Make no mistake about it, when the a.i. forecast turns bearish on stocks I will be heavily focused on finding ways to short the market as I think the narrative I have described in this article is ultimately very negative for stocks. But in reality my analysis could take weeks, or months to unfold. What I do know is the artificial intelligence will alert me when the trend forecasts have turned bearish.
The answer A.I. offers may surprise you.
This is how small traders grow their accounts by taking small bites out of the market consistently.
Today Artificial Intelligence, Machine Learning and Neural Networks are an absolute necessity in protecting your portfolio.
Intrigued? Visit with us and check out the a.i. at our Next Live Training.
We’ll discuss strategies like this one and show you at least three stocks that have been identified by the A.I. that are poised for big movement.
Discover why artificial intelligence is the solution professional traders go-to for less risk, more rewards, and guaranteed peace of mind.
It’s not magic. It’s machine learning.
Make it count!

IMPORTANT NOTICE!
THERE IS SUBSTANTIAL RISK OF LOSS ASSOCIATED WITH TRADING. ONLY RISK CAPITAL SHOULD BE USED TO TRADE. TRADING STOCKS, FUTURES, OPTIONS, FOREX, AND ETFs IS NOT SUITABLE FOR EVERYONE.
DISCLAIMER: STOCKS, FUTURES, OPTIONS, ETFs AND CURRENCY TRADING ALL HAVE LARGE POTENTIAL REWARDS, BUT THEY ALSO HAVE LARGE POTENTIAL RISK. YOU MUST BE AWARE OF THE RISKS AND BE WILLING TO ACCEPT THEM IN ORDER TO INVEST IN THESE MARKETS. DON’T TRADE WITH MONEY YOU CAN’T AFFORD TO LOSE. THIS ARTICLE AND WEBSITE IS NEITHER A SOLICITATION NOR AN OFFER TO BUY/SELL FUTURES, OPTIONS, STOCKS, OR CURRENCIES. NO REPRESENTATION IS BEING MADE THAT ANY ACCOUNT WILL OR IS LIKELY TO ACHIEVE PROFITS OR LOSSES SIMILAR TO THOSE DISCUSSED ON THIS ARTICLE OR WEBSITE. THE PAST PERFORMANCE OF ANY TRADING SYSTEM OR METHODOLOGY IS NOT NECESSARILY INDICATIVE OF FUTURE RESULTS. CFTC RULE 4.41 – HYPOTHETICAL OR SIMULATED PERFORMANCE RESULTS HAVE CERTAIN LIMITATIONS. UNLIKE AN ACTUAL PERFORMANCE RECORD, SIMULATED RESULTS DO NOT REPRESENT ACTUAL TRADING. ALSO, SINCE THE TRADES HAVE NOT BEEN EXECUTED, THE RESULTS MAY HAVE UNDER-OR-OVER COMPENSATED FOR THE IMPACT, IF ANY, OF CERTAIN MARKET FACTORS, SUCH AS LACK OF LIQUIDITY. SIMULATED TRADING PROGRAMS IN GENERAL ARE ALSO SUBJECT TO THE FACT THAT THEY ARE DESIGNED WITH THE BENEFIT OF HINDSIGHT. NO REPRESENTATION IS BEING MADE THAT ANY ACCOUNT WILL OR IS LIKELY TO ACHIEVE PROFIT OR LOSSES SIMILAR TO THOSE SHOWN.

