
![]()
TESLA Motors was founded in 2003 by entrepreneurs Martin Eberhard and Marc Tarpenning. Although their prior experience had been in technology, with no previous automotive industry experience to speak of, the team became an instant success with the unique design and engineering of the TESLA Roadster—a high-performance electric sports car steeped in modern luxury. This revolutionary concept combined a lightweight carbon fiber body with lithium-ion batteries, resulting in zero tailpipe emissions and a dramatic range that could compete with traditional gas vehicles. Despite being only 13 years old, TESLA Motors has become a household name that stands for innovation and environmental responsibility in the automotive sector.
Martin Eberhard and Marc Tarpenning founded Tesla motors in 2003, but they no longer play a role in the everyday running of the company. Martin left the company in 2007, while Marc remained until 2008. Since then, Elon musk has taken a strong lead as Chief Executive Officer, supported by experienced management teams with expertise across departments. Without their creators, Tesla Motors continues to go from strength to strength despite adversity; setting records and modifying public opinion to make electric cars part of our future.
When Elon Musk acquired TESLA in 2010, it marked the start of an incredible journey for both the company and Musk himself. At the time, Tesla had a variety of strategic advantages that attracted Musk and prompted him to purchase the company for $2.6 billion. Aside from the fact that he believed strongly in Tesla’s innovative approach to green energy, he saw potential in Tesla’s automotive platform after testing prototypes several months prior. Ultimately, this purchase was an incredible opportunity to create change through these alternative means as opposed to waiting for reactionary steps to be taken by government regulation. Today the company has a market cap of $42.78 billion and is the largest automaker in the world.
Musk’s currently owns approximately 20% of TESLA and continues to calculate potential risk-reward scenarios as he pushes towards further innovation within the industry. Nikola Tesla was a groundbreaking inventor whose many discoveries and experiments made him an iconic figure in the scientific community. Though he is most famous for his work with electricity, his name has become inexorably linked to the modern automobile brand Tesla Motors, who produce high-end electric cars that have revolutionized the industry. Today, the company strives to embody Tesla’s spirit of pushing boundaries – whether it be developing industry-leading features like their Autopilot driver assistance systems or maintaining competitively low prices on all their vehicles.
In the competitive electric vehicle (EV) market, Tesla has a strong hold but faces challenges from other big names. While the exact figure is hard to pinpoint, it’s estimated that Tesla has a market share of around 20-25%, with companies like Audi, BMW, Mercedes and even Kia Motors vying for a piece of the pie. With technological advancements taking place at lightning speed these days, Tesla’s competitors aren’t standing still either – they’re keen to catch up and overtake their competition. EV technology is becoming easier and more accessible each day, giving consumers plenty of options at varying costs. Though it may face stiff competition in this area, Tesla has maintained its dominance due to its high level of innovation and commitment to quality products. Likewise, the TESLA brand has become known for its ambitious and outspoken CEO, Elon Musk. It’s safe to say that many decisions made by Elon Musk while heading a multibillion-dollar corporation certainly raise eyebrows and leave some members of the industry unsettled.
TESLA is a company that is determined to shape the future of the automotive industry, but with this comes several main challenges. One of these challenges is the high costs associated with their product research and development, which can be difficult to finance and mitigate. Additionally, they must compete against existing markets that have proven successful over long periods of time which challenges them to innovate in ways those markets cannot. Finally, the ability to have their products accepted mainstream requires an extensive marketing campaign that need strategies that fit the brand image. TESLA faces an exciting road ahead as they try to revolutionize the auto industry.
Tesla, Inc. is one of the largest stocks in the United States and around the world. As a result, its presence in the stock market is essential for many indexes to function. Tesla is a component of three major stock market indexes: the S&P 500, NASDAQ 100, and Dow Jones Industrial Average. The S&P 500 is a globally recognized index that covers around 80% of available market capitalization and measures overall performance across a range of large-cap U.S stocks. The NASDAQ 100 meanwhile tracks the performance of non-financial companies listed on the NASDAQ Global select Market Index; it’s made up primarily of technology stocks and tends to be more volatile than other indices. Finally, the Dow Jones Industrial Average looks at 30 blue-chip stocks to measure overall performance; Tesla’s one among them because it meets criteria like having an excellent track record and retention rate. These three market indexes prove how compelling Tesla’s role in the Stock exchange truly is.
On the negative side $TSLA was among the worst performing stocks of 2022.
On the positive side Tesla has announced that it expects earnings to grow by 18.47% per year. Also, earnings over the past year grew by 127.3%! This was all occurring while the stock lost 75% of its market value and slid from a high of $384 to a low of $101. TESLA is extremely optimistic about its expansion moving forward. It has opened two new gigafactories, one in Berlin Germany and the other is Austin, Texas. The expectation is that this will allow them to produce 2 million electric vehicles per year. Also, analysts are expecting that revenue growth for $TSLA will exceed $100 billion for the first time in the company’s history.
Earnings will be a key driver for $TSLA. The next earnings date is anticipated to be April 19, 2023.
Elon Musk has publicly commented that by 2030 he anticipates the creation of an additional 10 gigafactories and that the company will be producing roughly 20 million electric vehicles per year.
In this weekly stock study, we will look at and analyze the following indicators and metrics as are our guidelines which dictate our behavior in deciding whether to buy, sell, or stand aside on a particular stock.
- Wall Street Analysts’ Estimates
- 52-week high and low boundaries
- Best Case – Worst Case Analysis and Takeaways
- Vantagepoint A.I. Forecast (Predictive Blue Line)
- Neural Network Forecast
- Daily Range Forecast
- Intermarket Analysis
- Our trading suggestion
We don’t base decisions on things like earnings or fundamental cash flow valuations. However, we do look at them to better understand the financial landscape that a company is operating under.
Wall Street Analysts’ Estimates
The 37 analysts offering 12-month price forecasts for Tesla Inc have a median target of $195.00, with a high estimate of $338.00 and a low estimate of $24.33. The median estimate represents a +12.91% increase from the last price of $172.71.
You can quickly see that within the estimates themselves there is unprecedented volatility. Analysts and traders alike see $TSLA as a very polarizing stock.
52-Week High and Low Boundaries
Looking at the Long-Term chart of $TSLA provides us with the 52-week high and low boundaries. Over the past year we have seen $TSLA trade as low as $101.81 and as high as $284.29. The annual trading range has been $282.48. Currently, the stock is trading at the 25th percentile of its annual range.
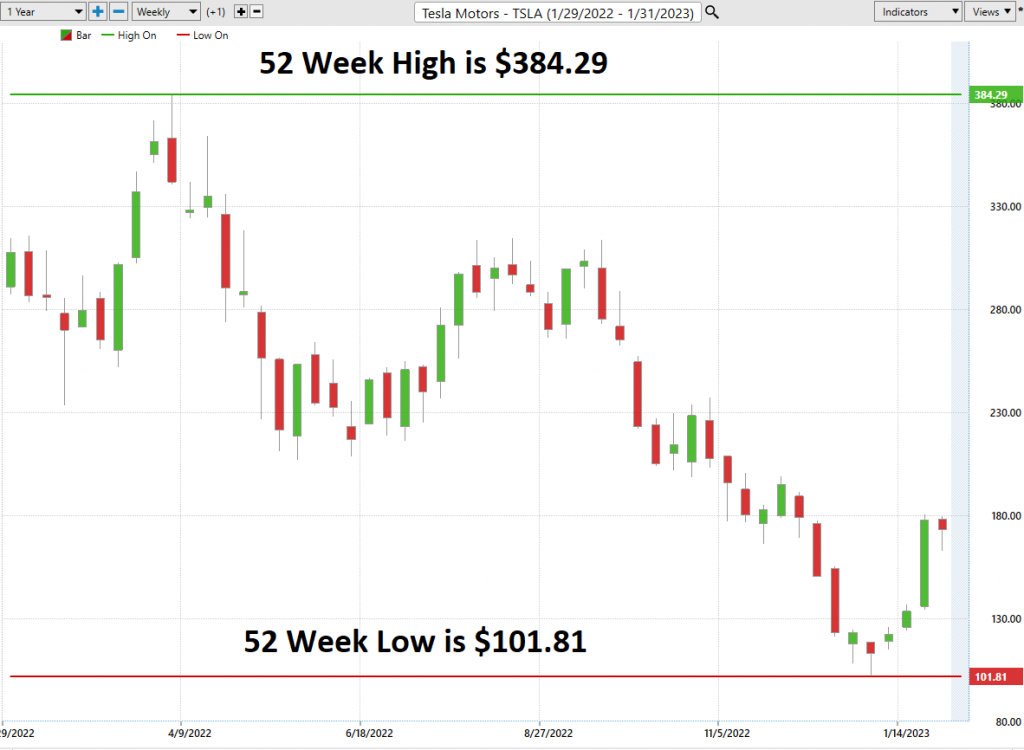
You can quickly understand the volatility inherent in $TSLA when you study the longer-term chart and see how in the last 3 years it exploded in price. On the 10-year chart, TSLA is trading at its 41st percentile.
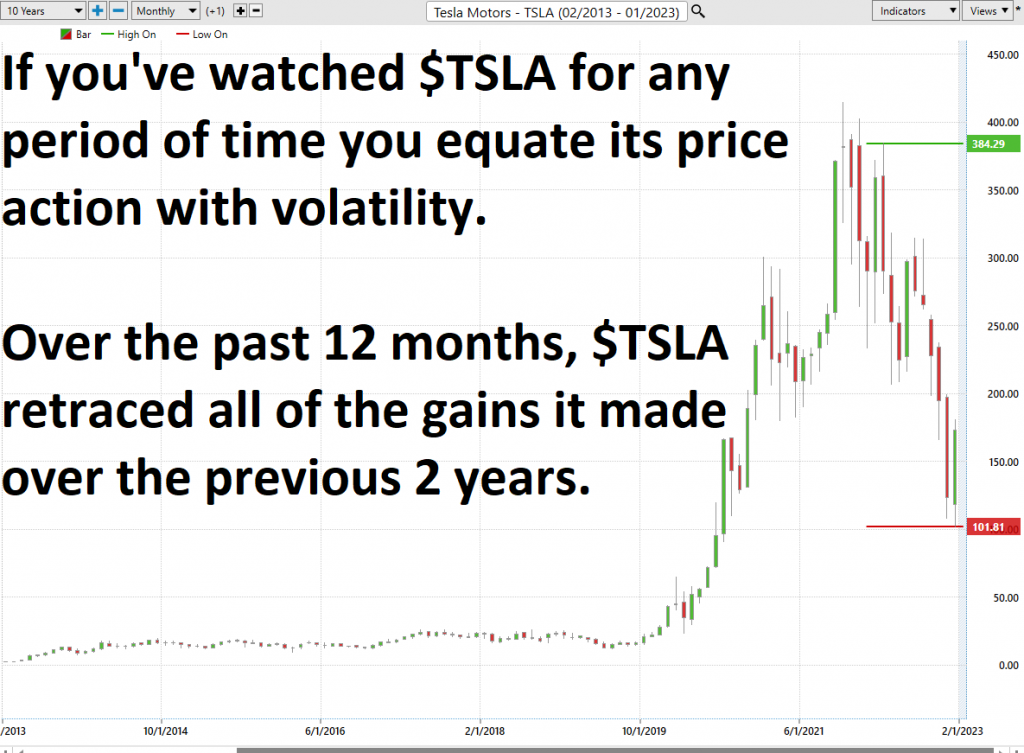
From this very simple analysis, we get a flavor of how volatility presents itself in $TSLA. To accompany this analysis what we would also like to do is divide the annual trading range of $282.48 and divide it by the price of $173.22. This calculation provides us with a broad based metric of statistical volatility. This metric now stands at 163%, which is exceedingly high.
Best Case – Worst Case Scenario
When we study the long term 52-week chart we can look at the best case and worst-case scenarios just to get an eyeball perspective of the risk and volatility of this asset. This is worth doing anytime you invest or trade to monetarily understand what the potential risks and rewards have been over the past year. To accomplish this we simply connect the high points and low points on the chart over the past year to be able to measure the rallies against the declines.
It is worth doing this type of baseline analysis because it allows you to visually ascertain how quickly a stock drops in comparison to the speed with which it moves higher.
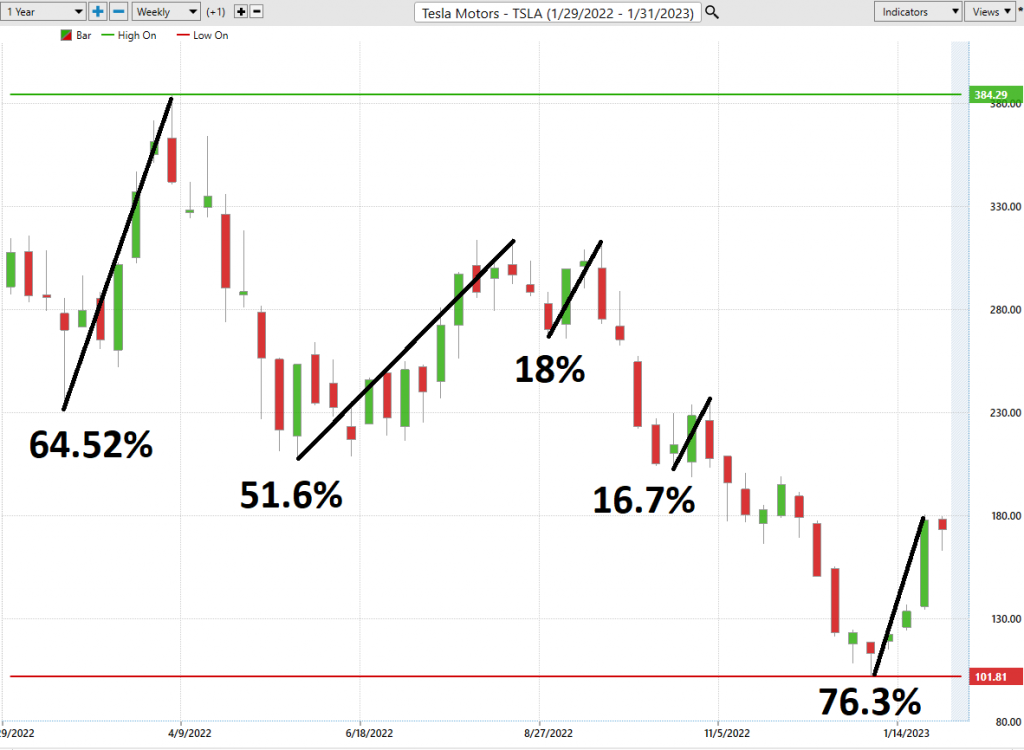
Followed by the worst-case analysis.

From this simple analysis, you can visualize and compare the rallies to the declines and see how quickly they occurred and whether the gains or losses were sustained.
Next, we want to compare the performance of $TSLA to the major broad market indexes.
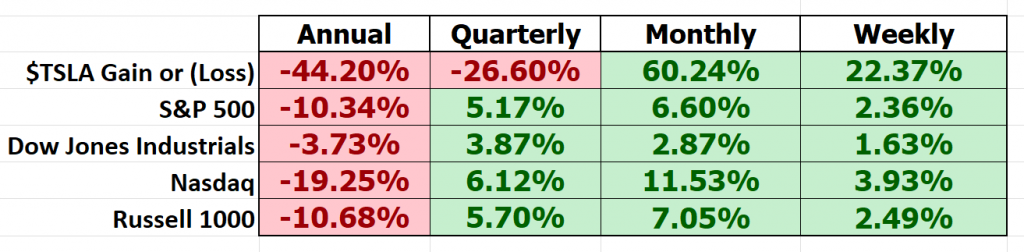
So, in $TSLA we have an asset which you can quickly see is much more volatile than the broader stock market indexes. What is interesting in this regard is that $TSLA is a component of the NASDAQ, S&P 500 and Dow Jones Industrials. You can understand now that when $TSLA rallies it affects the entirety of stocks.
Vantagepoint A.I. Forecast Predictive Blue Line
On the following chart you will see the power of the VantagePoint Predictive blue line which determines the medium term trend price forecast.
The guidelines we abide by are as follows:
- The slope of the predictive blue line determines the trend forecast and general direction of $TSLA.
- Ideally, the VALUE ZONE is determined to try and find buy opportunities at or below the predictive blue line, or to sell opportunities above the predictive blue line during a downtrend.
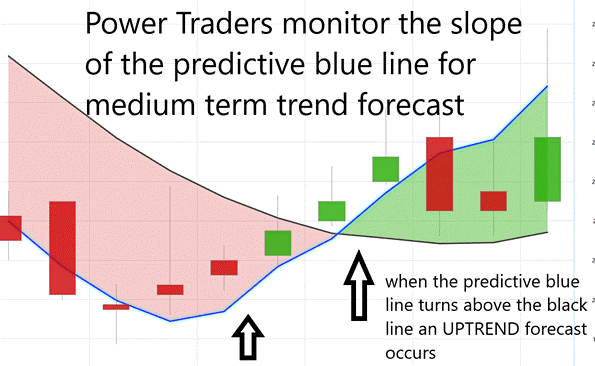
Using VantagePoint Software and artificial intelligence, traders are alerted to trend forecasts by monitoring the slope of the predictive blue line.
The predictive blue line, however, utilizes the VantagePoint-patented Neural Network and Intermarket Analysis to arrive at its value. It looks at the strongest price drivers of an asset through artificial intelligence and statistical correlations to determine its value.
What is fascinating about the chart is that by simply eyeballing the chart we can see that the slope of the predictive blue line is like the NORTH STAR in providing directional guidance to traders. In other words, don’t fight the trend. The trading opportunities might last a few days or several weeks, but the focus is always to keep the trader on the right side of the right trend at the right time. The blue line ALWAYS determines the forecast and the best move forward.
Normally an UPTREND forecast occurs when you have two consecutive closes above the predictive blue line. On the downside the inverse is also true. A downtrend forecast normally occurs when you have two consecutive closes below the predictive blue line.
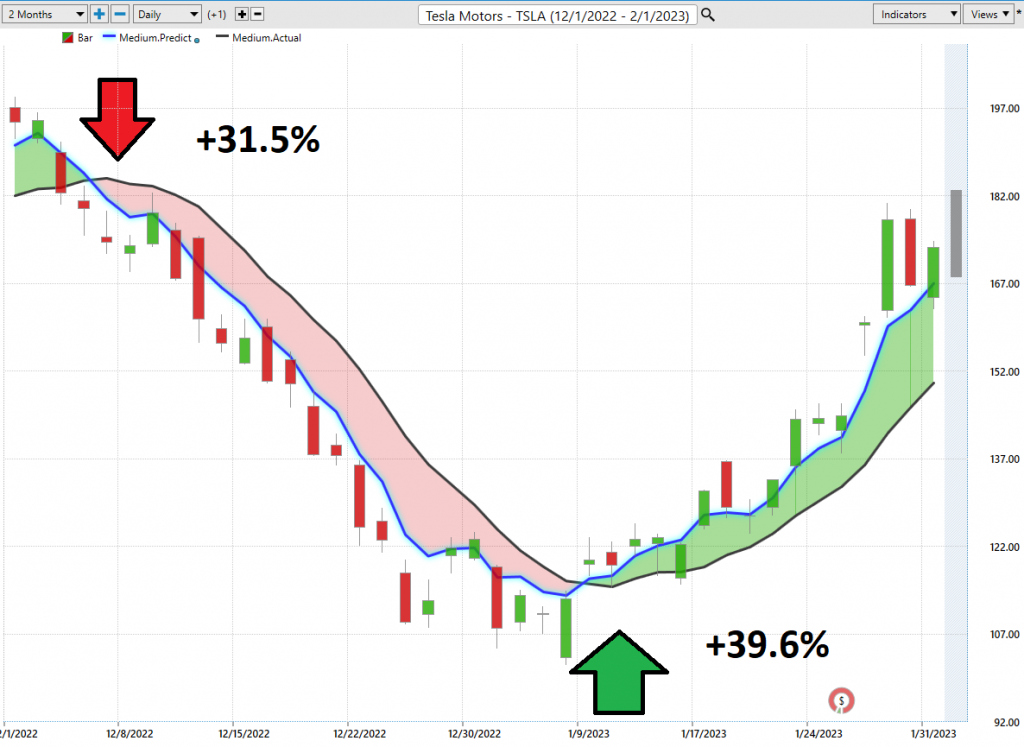
DOWN Move saw maximum gains of 31.5%.
The UP Move saw maximum consecutive gains of 39.6%.
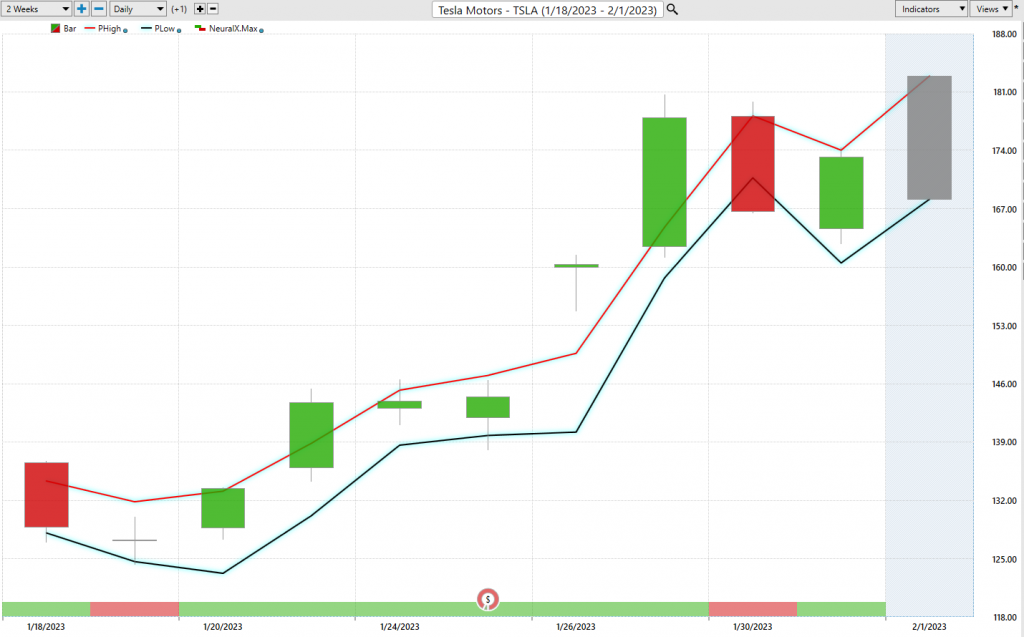
Neural Network Indicator (Machine Learning)
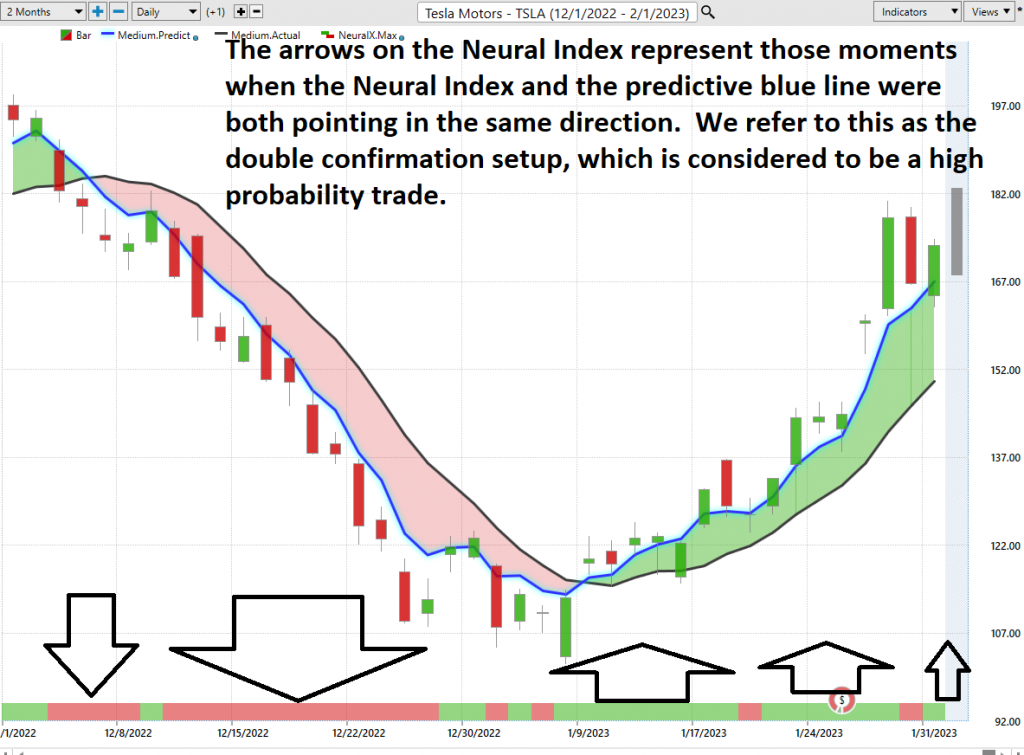
At the bottom of the chart is the Neural Network Indicator which predicts future short-term strength and/or weakness in the market. When the Neural Net Indicator is green it communicates strength. When the Neural Net is Red it is forecasting short term weakness in the market. When it is yellow it is anticipating sideways prices.
A Neural Net is a computational learning system that uses a network of functions to understand and translate massive amounts of data into a desired output, consistently monitoring itself and improving its performance.
Neural networks in trading are AI-powered algorithms that analyze market data and learn from the outcomes to continuously evaluate relative risk and opportunity. Neural networks need to first select the criteria for what market signals the network should analyze, such as technical indicators, chart patterns, global events, or company projections. After collecting input from relevant market data, the neural network helps traders by generating new insight from each experience. By identifying relationships between different triggers and outcomes in the markets, it can monitor for risks or identify new opportunities faster than humanly possible. For example, it may notice correlations between sudden changes in oil prices with unexpected movements of a stock index in a particular region, thereby giving traders an edge over others who lack such understanding.
Neural Networks are essentially trainable algorithms that emulate aspects of the human brain. This means they can be trained based upon criteria for assessing risk and potential reward to determine the best move forward. This allows them to make high probability forecasts based on available historical information.
We advocate that Power Traders cross reference the chart with the predictive blue line and neural network indicator to create optimal entry and exit points.
For the serious trader, neural networks are a next-generation trading tool that can detect subtle non-linear interdependencies and patterns that traditional methods of technical analysis are unable to uncover.
Traders look for confirmation on NeuralNet to position themselves LONG or SHORT in the market. In other words, when the A.I. forecast is green, and The Neural Net is green, that presents a buying opportunity.
The inverse is also true, when the A.I. forecast is red and the Neural Net is red, that is a selling opportunity. The arrows on the chart below highlight the trading zones where Power Traders would’ve been using double confirmation to BUY in cross referencing the A.I. forecast with the NeuralNet.
Power Traders are always looking to apply both the Neural Network and A.I. to the markets to find statistically sound trading opportunities.
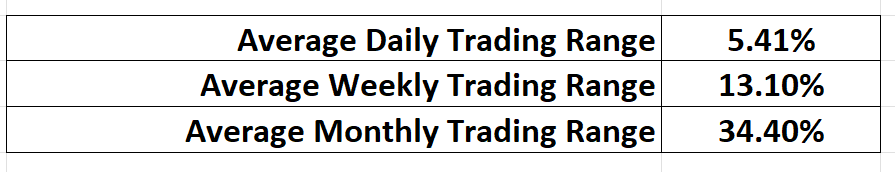
VantagePoint Software Daily Price Range Prediction
One of the powerful features in the VantagePoint Software which Power Traders use daily is the Price Range prediction forecast. This forecast is what permits Power Traders to truly fine tune their entries and exits into the market.
Here are the metrics for what the average trading ranges have been over the last year on a daily, weekly and monthly basis.

But even armed with this information a trader needs to decide where to enter and exit the market.
Every day traders are faced with the anxiety and frustration of wondering where they should be looking to buy and sell the market. VantagePoint’s A.I. makes this decision super easy with the Daily Price Range Forecast.
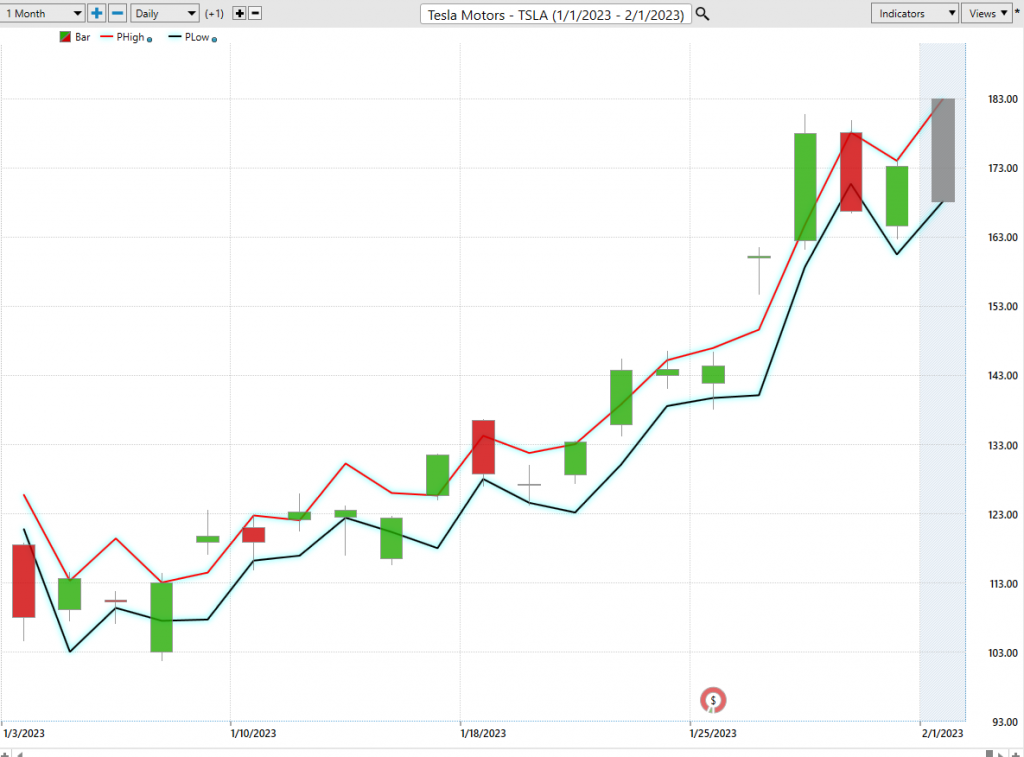
This chart helps traders decide where to stop placement should occur. Observe how placing protective sell stops below the dark line on the chart was a powerful way to minimize risk in this trade.
See how the upper and lower bands of the price range forecast for a very clear channel of trading activity as well. Swing traders are always looking for buying opportunities towards the bottom of the predicted channel and try to find selling opportunities above the top band.
Intermarket Analysis
Power lies in the way we respond to the truth we understand.
One of the supremely important questions in trading is what is driving the price? Headlines often create interesting narratives. But these “stories” only capture the imagination. Traders want and need to understand the cause and effect of price movement.
The only way to get an answer to this important question is through Intermarket analysis which looks at statistical price correlations of assets.
We live in a global marketplace.
Everything is interconnected.
Intermarket analysis is a crucial tool used by traders to evaluate different markets and asset classes and form trading strategies based on these relationships. By studying the correlations among different markets, traders can use this knowledge to recognize potential opportunities, make informed decisions regarding entry, and exit points. For instance, changes in commodities prices can inform a trader of future developments in related currency pairs, or a trader could use the signals provided by large-cap stocks to anticipate movement in small-cap stocks. Intermarket analysis helps traders gain insight into the broader market environment to determine an optimal strategy for achieving profits.
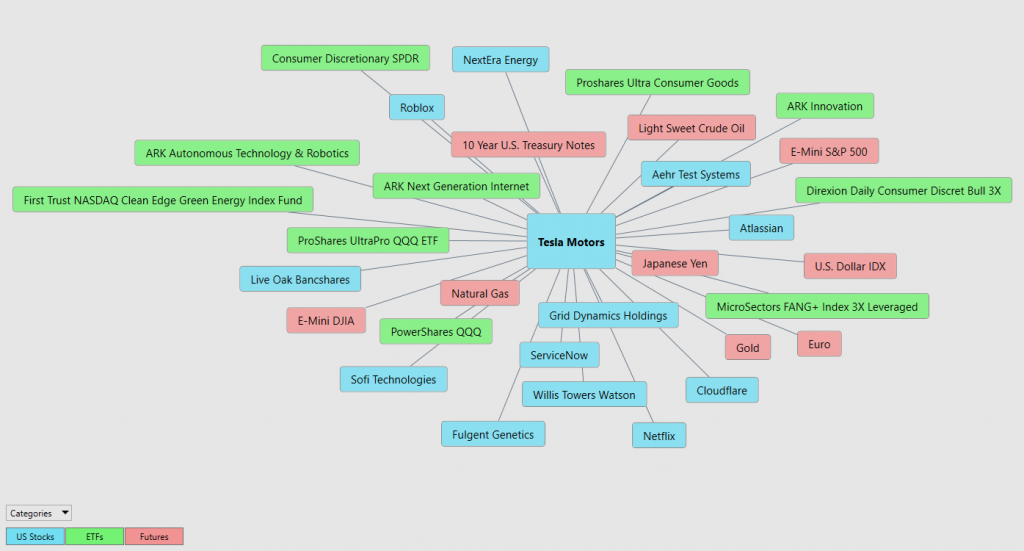
Interest rates, Crude Oil Prices, and the volatility of the Dollar amongst thousands of other variables affect the decisions companies must make to flourish and prosper in these challenging times. Trying to determine what these factors are is one of the huge problems facing investors and traders.
There is great value to be had in studying and understanding the key drivers of $TSLA’s price action. This graphic provides a microcosmic view of what factors have been driving $TSLA’s higher. You will find all of the prominent stock indexes and tech ETF’s that are big owners of $TSLA in that graphic.
Our Suggestion
Charts are the footprints of money flows.
Since $TSLA is a component of the NASDAQ index, the S&P 500 Index, and the Dow Jones Industrials we can appreciate how much enthusiasm exists for an UPTREND to return. As goes $TSLA so often go the broader market indexes.
Tesla has numerous major challenges in 2023.
• In North America, EV competition is light compared to the rest of the world., Meanwhile internationally it is increasing significantly – especially in China where subsidies ended on December 31st.
• Both markets share one thing: A weak economy will negatively affect EV sales worldwide, particularly Tesla’s more expensive offerings.
If you think RECESSION will happen in 2023 either domestically or worldwide, $TSLA is a bad purchase.
However, if you think that the FED will engineer a soft landing so that we can avoid recession in the economy, betting on Elon Musk has been a winning bet over the last decade in a big way.
Currently, as this gets published, the trend is UP.
Momentum is UP.
Based upon the trading range possibilities we will continue to look for trading opportunities based upon the Vantagepoint Daily Range Forecast.
We like the $TSLA narrative and think the upside can be explosive. We like the reality that the stock is highly volatile, which gives our trading style an edge. We will continue to explore the long side of the market for short-term swing trading opportunities.
Our recommendation is to follow the A.I. trend analysis as outlined in this stock study and practice good money management on all trades.
We will re-evaluate daily based upon:
- New Wall Street Analysts’ Estimates
- New 52-week high and low boundaries
- Vantagepoint A.I. Forecast (Predictive Blue Line)
- Neural Network Forecast
- Daily Range Forecast
The trend in $TSLA is down. We want to get long but will not disrespect the current trend.
Let’s Be Careful Out There!
It’s Not Magic.
It’s Machine Learning.

IMPORTANT NOTICE!
THERE IS SUBSTANTIAL RISK OF LOSS ASSOCIATED WITH TRADING. ONLY RISK CAPITAL SHOULD BE USED TO TRADE. TRADING STOCKS, FUTURES, OPTIONS, FOREX, AND ETFs IS NOT SUITABLE FOR EVERYONE.
DISCLAIMER: STOCKS, FUTURES, OPTIONS, ETFs AND CURRENCY TRADING ALL HAVE LARGE POTENTIAL REWARDS, BUT THEY ALSO HAVE LARGE POTENTIAL RISK. YOU MUST BE AWARE OF THE RISKS AND BE WILLING TO ACCEPT THEM IN ORDER TO INVEST IN THESE MARKETS. DON’T TRADE WITH MONEY YOU CAN’T AFFORD TO LOSE. THIS ARTICLE AND WEBSITE IS NEITHER A SOLICITATION NOR AN OFFER TO BUY/SELL FUTURES, OPTIONS, STOCKS, OR CURRENCIES. NO REPRESENTATION IS BEING MADE THAT ANY ACCOUNT WILL OR IS LIKELY TO ACHIEVE PROFITS OR LOSSES SIMILAR TO THOSE DISCUSSED ON THIS ARTICLE OR WEBSITE. THE PAST PERFORMANCE OF ANY TRADING SYSTEM OR METHODOLOGY IS NOT NECESSARILY INDICATIVE OF FUTURE RESULTS. CFTC RULE 4.41 – HYPOTHETICAL OR SIMULATED PERFORMANCE RESULTS HAVE CERTAIN LIMITATIONS. UNLIKE AN ACTUAL PERFORMANCE RECORD, SIMULATED RESULTS DO NOT REPRESENT ACTUAL TRADING. ALSO, SINCE THE TRADES HAVE NOT BEEN EXECUTED, THE RESULTS MAY HAVE UNDER-OR-OVER COMPENSATED FOR THE IMPACT, IF ANY, OF CERTAIN MARKET FACTORS, SUCH AS LACK OF LIQUIDITY. SIMULATED TRADING PROGRAMS IN GENERAL ARE ALSO SUBJECT TO THE FACT THAT THEY ARE DESIGNED WITH THE BENEFIT OF HINDSIGHT. NO REPRESENTATION IS BEING MADE THAT ANY ACCOUNT WILL OR IS LIKELY TO ACHIEVE PROFIT OR LOSSES SIMILAR TO THOSE SHOWN.

