

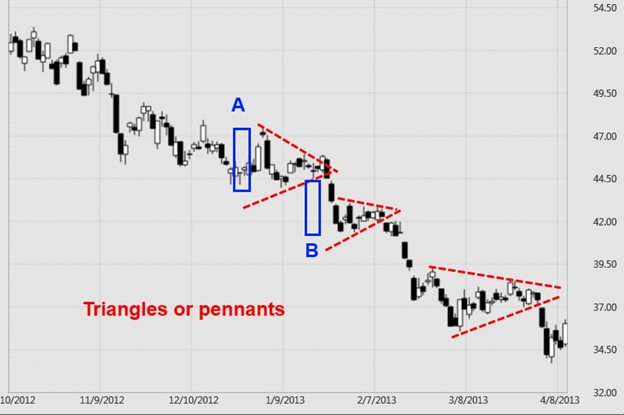
Sometimes continuation patterns take a form that can best be described as a symetrical triangle or pennant. Using the same chart below as the bear flag example, note that various forms of triangles can also appear as short-term corrections or congestion areas in an ongoing trend. The price ranges in a triangle tend to get narrower and narrower as prices move toward the apex of the triangle. As with flags, if the trend is strong, prices tend to break out in the direction of the trend that existed going into the pattern.
Source: TradeShark
Of course, traders cannot be sure a continuation pattern is forming while it is in progress, but they can get some very useful information as it takes shape:
(1) The breakout points can be used to determine where to place entry or exit orders and
(2) The width of the base of the triangle (blue A on chart above) can be used to project potential price targets because the move if/when prices break out of the formation is often about the same as the triangle base (blue B).

