

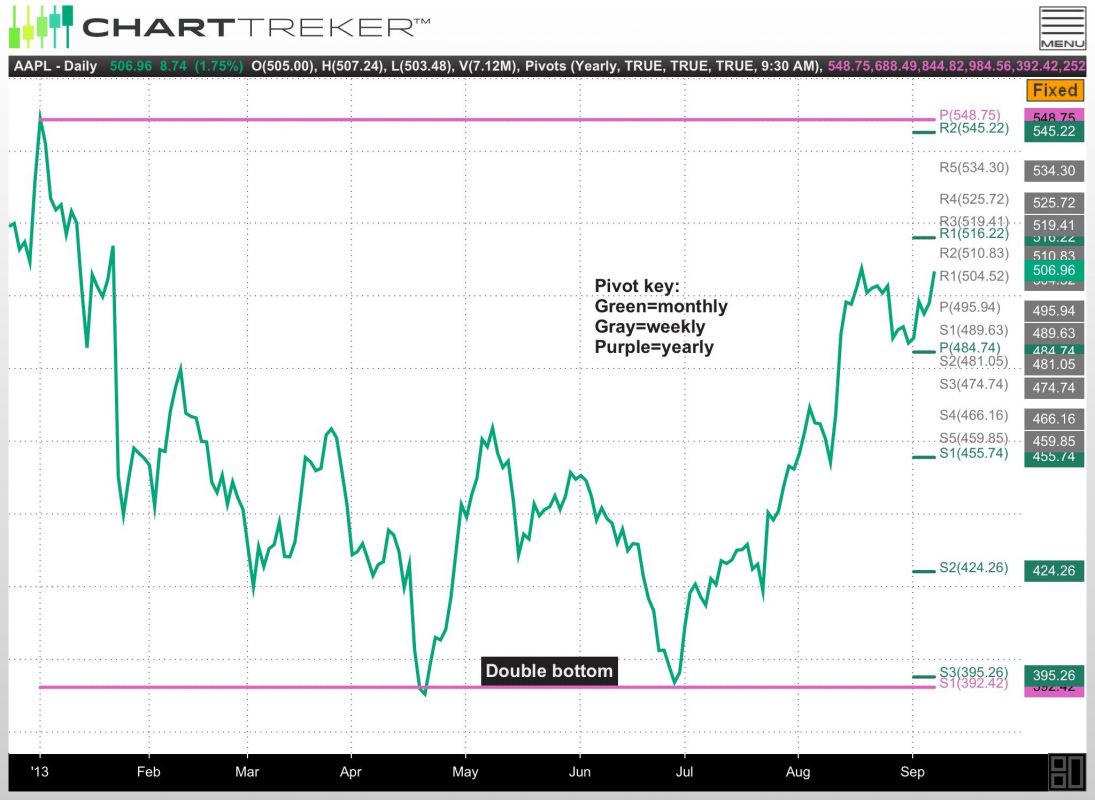
Last January, the charts showed the Apple (AAPL) stock price was having difficulty trading over the 2013 yearly pivot point (P) at $549. That told me that Apple’s stock price would probably go down to the yearly S1 pivot point at $392.
LOOKING BACK
As my followers on Twitter (@mpgtrader) know, several times last winter and spring, I tweeted to look for support on Apple at the yearly S1 pivot. Last April and in late June, Apple did test the yearly S1 pivot point and bounced both times off there (double bottom).
WHAT’S NEXT
Pivot point analysis now shows that Apple should go back up to the yearly pivot point (P) at $549, maybe higher.
WHY IT WORKS
The pivot point (P) is where price usually goes back to after testing a support or resistance pivot (i.e.: s1 or r1). The pivot point is where pricing is the most fair (efficient). Price usually swings back and forth, like on a bell curve or an arc. When price swings too far to the downside or upside, it usually comes back to the pivot point. This works on daily, weekly, monthly and yearly time frames.
Pivot points give me a trading edge over traditional technical analysis.
= = =
Do you use pivot point analysis or have any questions on it? Please post a comment for York below.

