Potential breakout entry in (IJR) – The Wagner Daily
The Wagner Daily – January 4, 2011
Concise technical analysis and picks of the leading global ETFs
Commentary:
The first trading day of 2011 brought with it substantial volume and strong gains across all major indices. The small-cap Russell 200 led the charge as it rallied 1.9% on the session. The technology rich Nasdaq closed up 1.5%, while the S&P MidCap 400 rose 1.4% on Monday. The S&P 500 and the Dow Jones Industrial Average ended Monday’s session with gains of 1.1% and 0.8% respectively.
For the first time in several weeks, market internals were decidedly positive. Volume skyrocketed on both the NYSE and the Nasdaq by an impressive 88%. Advancing volume overpowered declining volume on both major indices. The ratio was plus 5 to 1 on the NYSE and plus 4 to 1 on the Nasdaq.
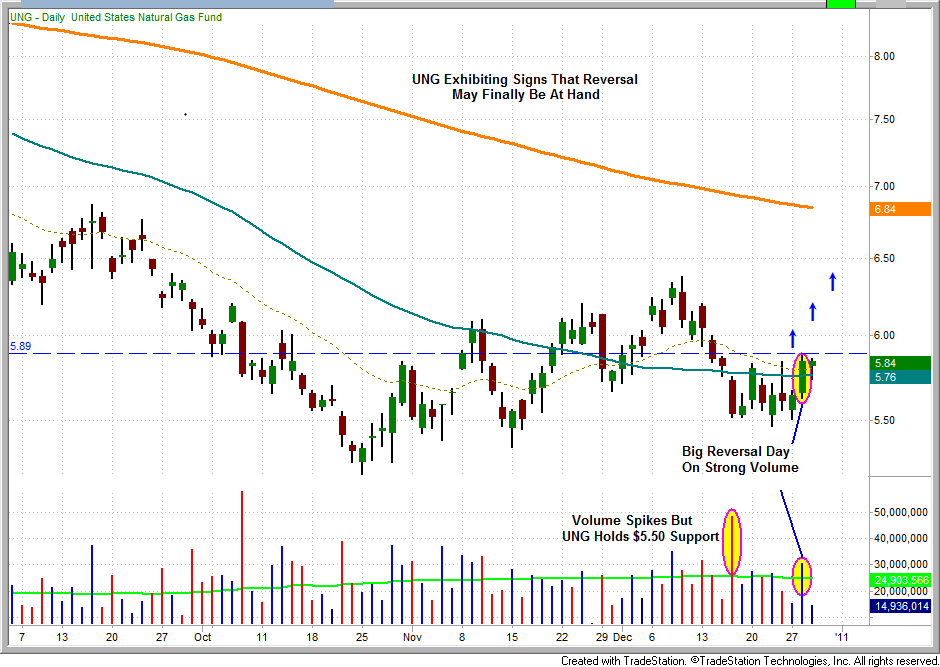
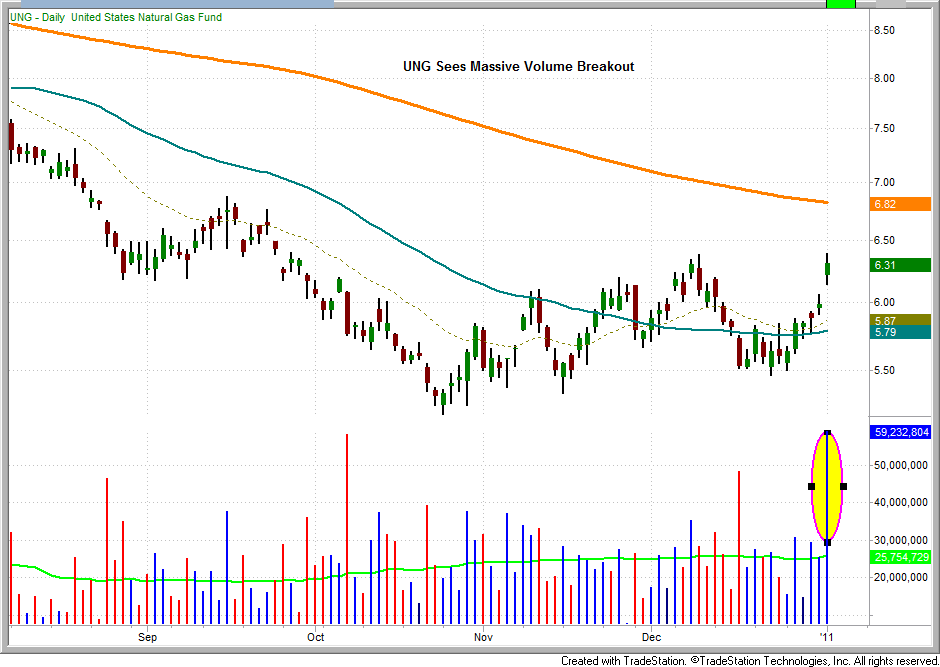
In the November 30th newsletter we stated that “a move back above $5.88 could very well be the catalyst for a sustained reversal” in UNG. Today, UNG witnessed an explosion in volume and closed up almost 5%. The charts below provide a good visual that supports the commentary we made last week.
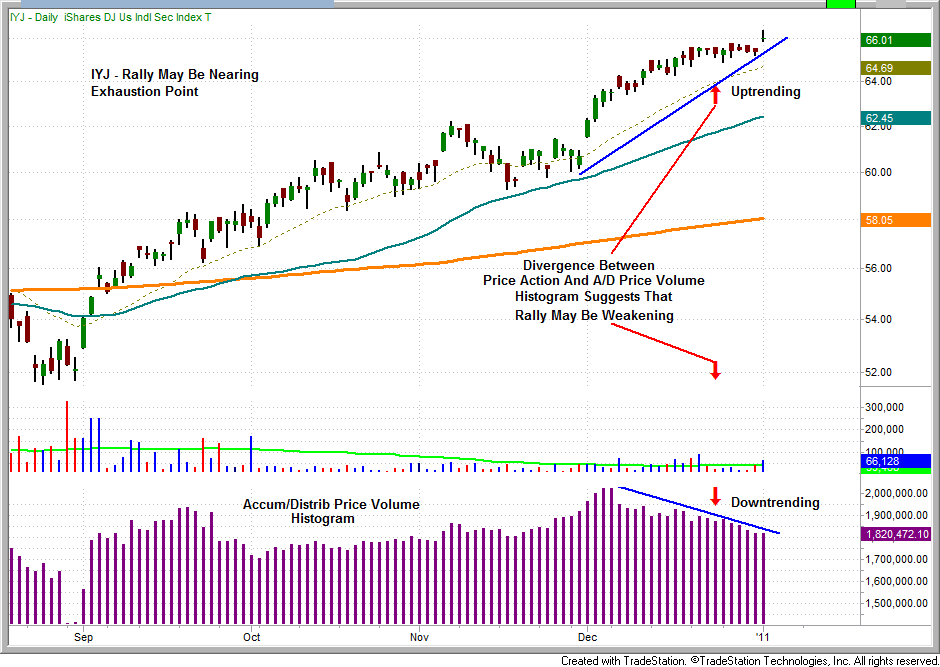
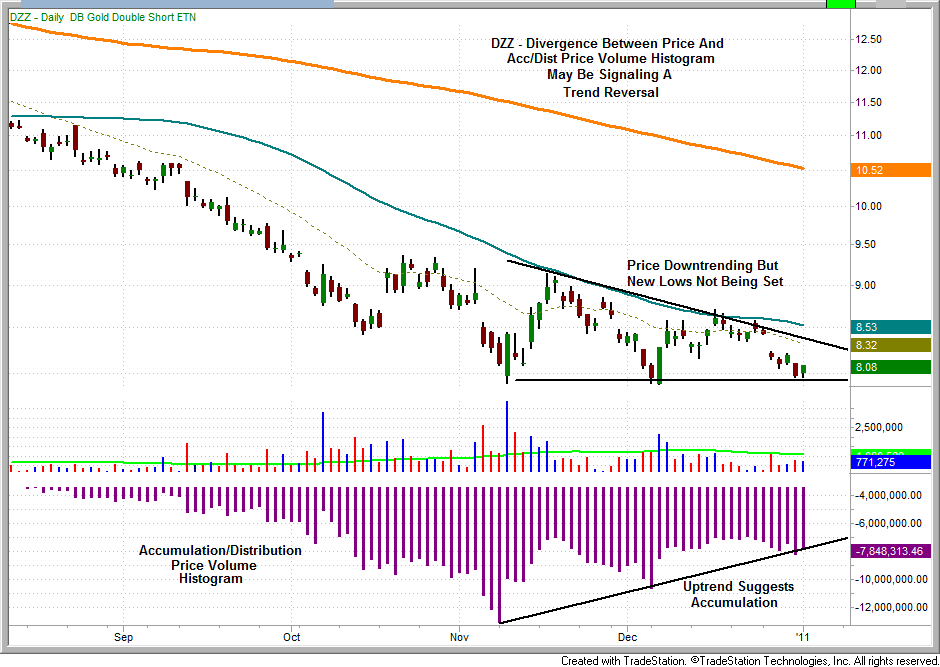
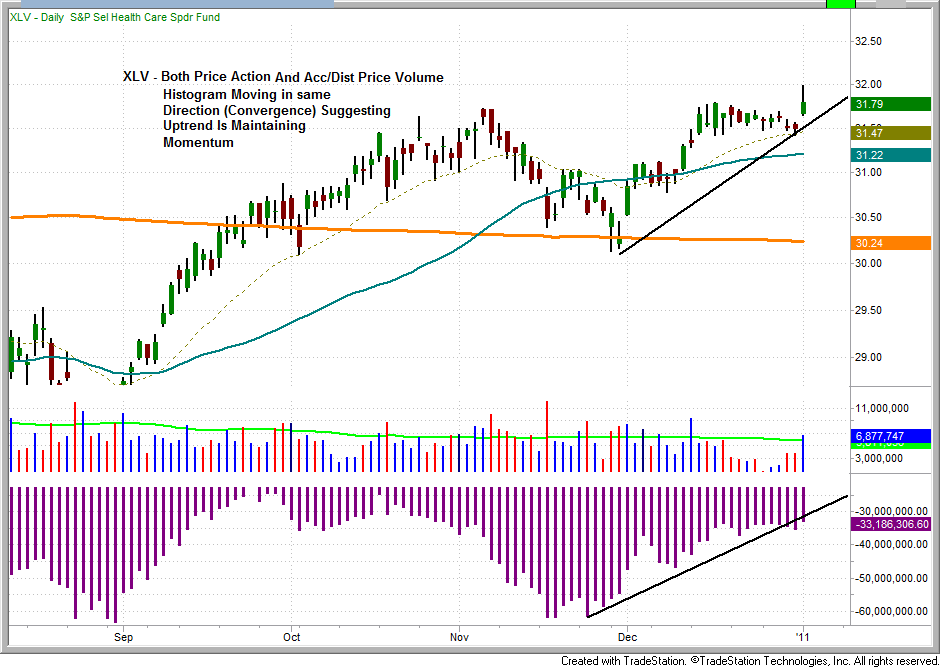
Overall, today’s market action would likely be categorized as bullish by most technical analysts. And for the most part it probably was. However, the market often provides subtle clues that individual ETFs and/or the broad market itself may be nearing a trend reversal. A technical indicator that we use to assist us in gauging the strength behind a current trend is the Accumulation Distribution Price Volume indicator. This indicator uses the relationship between the open and the close of the price bar, and the range of the bar, to weight volume as either Accumulation volume (buying) or Distribution volume (selling). Without getting into overwhelming detail, suffice it to say that the trend direction of the Accumulation Distribution Price Volume Indicator is more important than its whole number value. A divergence between price and the Accumulation Distribution Price Volume line (histogram) may indicate a trend reversal, indicate that the current trend is likely to continue or in some cases provide no signal at all. Below are charts of three ETFs in which this indicator is utilized as a possible leading signal for a trend reversal or as a confirmation of the existing trend. We never use this technical indicator for short term trading as it tends to work better as a leading indicator over a period of weeks or months. Our purpose for discussing it today is to make our readers aware that the strength of the current trend may be weakening. The charts below are self explanatory.
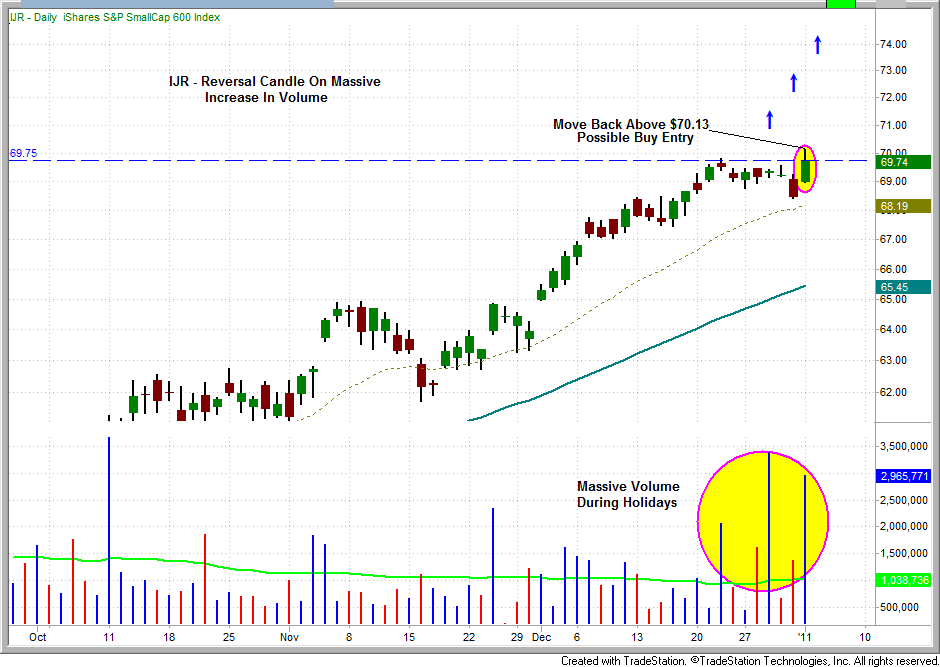
The iShares S&P Small Cap 600 Index ETF (IJR) is poised for a potential breakout move. Over the past eight trading sessions this ETF has seen very high volume, while it has been consolidating. Yesterday, on a massive increase in volume IJR formed a bullish reversal candle and temporarily set a new high. A move back above $70.13 could provide a buy entry for this ETF. We are placing IJR on the watchlist. For our members, trade details can be found in the watchlist portion of the newsletter.
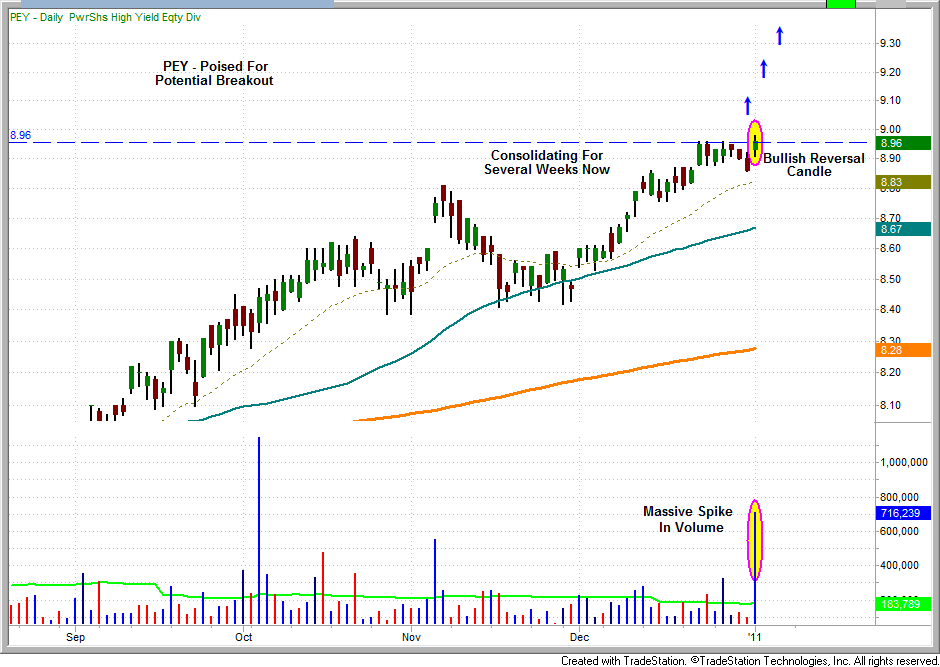
The PowerShares High Yield Equity Dividend ETF (PEY), is exhibiting similar technical characteristics as IJR. On a massive burst in volume yesterday, PEY broke to new highs only to end the day back in the eight day trading range. It also formed a very bullish reversal candle. A gap-up or rally above $8.98 could potentially provide a long entry opportunity for this ETF. We are watching this trade for a possible long entry.
Although trade was heavy and overall market action bullish, a late day flurry of selling suggests that there was selective distribution into strength. Still, most industry groups participated in the rally and the uptrend appears to remain intact.
Deron Wagner is the Founder and Head Portfolio Manager of Morpheus Trading Group, a capital management and trader education firm launched in 2001. Wagner is the author of the best-selling book, Trading ETFs: Gaining An Edge With Technical Analysis (Bloomberg Press, August 2008), and also appears in the popular DVD video, Sector Trading Strategies (Marketplace Books, June 2002). He is also co-author of both The Long-Term Day Trader (Career Press, April 2000) and The After-Hours Trader (McGraw Hill, August 2000). Past television appearances include CNBC, ABC, and Yahoo! FinanceVision. Wagner is a frequent guest speaker at various trading and financial conferences around the world, and can be reached by sending e-mail to: deron@morpheustrading.com.
DISCLAIMER: There is a risk for substantial losses trading securities and commodities. This material is for information purposes only and should not be construed as an offer or solicitation of an offer to buy or sell any securities. Morpheus Trading, LLC (hereinafter “The Company”) is not a licensed broker, broker-dealer, market maker, investment banker, investment advisor, analyst or underwriter. This discussion contains forward-looking statements that involve risks and uncertainties. A stock’s actual results could differ materially from descriptions given. The companies discussed in this report have not approved any statements made by The Company. Please consult a broker or financial planner before purchasing or selling any securities discussed in The Wagner Daily (hereinafter “The Newsletter”). The Company has not been compensated by any of the companies listed herein, or by their affiliates, agents, officers or employees for the preparation and distribution of any materials in The Newsletter. The Company and/or its affiliates, officers, directors and employees may or may not buy, sell or have positions in the securities discussed in The Newsletter and may profit in the event the shares of the companies discussed in The Newsletter rise or fall in value. Past performance never guarantees future results.
Charts created by TradeStation (tradestation.com).
© 2002-2010 Morpheus Trading, LLC
Reproduction without permission is strictly prohibited.


