
After enjoying a rise of approximately 42% from its major reversal low of 666.79 (set on March 6, 2009) the S&P 500 index then began a period of consolidation (on May 8, 2009) before attempting another break higher a couple of sessions ago. The recent upside breakout was notable for its wide daily range and above-average volume participation across all major stock industry groups. As I write this article (midday on June 3, 2009), the S&P 500 index has pulled back significantly, all the way down toward the 926 area – very close to the price zone that coincided with Monday’s bullish breakout move.
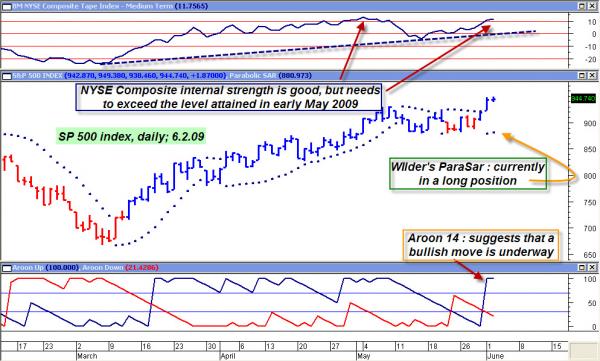
The question now is this: ‘Does the balance of the technical evidence suggest tht the S&P 500 (along with the rest of the broad US markets) is entering a more substantial period of consolidation and/or correction, or is today’s downdraft simply a healthy pullback toward a former breakout resistance level?’ There are several useful technical tools displayed on the S&P 500 daily chart, which may help us get a better grasp of the current situation. First off, notice the NYSE ‘internal strength’ indicator at the top of the chart; although this indicator (constructed from a weighted mix of the NYSE’s advancing/declining issues, new highs/new lows, up volume/down volume and the rate of change in the index price itself) is currently rising (as of Tuesday’s close), for another sustained round of bullish gains this indicator will need to meet and then exceed the value it attained in early May 2009. Right now, a minor bearish divergence is evident, because even though the index made a fresh yearly high after Monday’s breakout, the internal strength indicator has so far failed to manifest the same measure of strength as it did a month ago.
Next, look at a more bullish indicator, the Aroon (14) indicator at the bottom of the chart. When the blue line crosses the red line, its normal to see a period of price gains, duration unknown. Further, the standard ParaSar trading system (created by J. Welles Wilder many years ago, and also overlaid on this chart) is also in a bullish mode, having recently switched to the long side of the market. Those familair with the ParaSar trading system realize that it’s one of those ‘always in the market’ (either long or short) kinds of systems. Finally, there is one other bullish factor that may also weigh in favor of further gains for the S&P 500 index, and that’s the fact that its current internal strength reading is substantially higher than it was in early January 2009, when the index was at a similar price level.
Bottom line: Expect the S&P 500 to test support as it pulls back from Monday’s rally out of consolidation. A failure of support at 924-925 could start a larger corrective phase down toward 880. However, longer-term, this index could be heading much higher, given that its internal strength remains far above those levels witnessed earlier this year.
ChartW59’s Website : http://www.chartw59.com

