Wednesday 9 September 2009
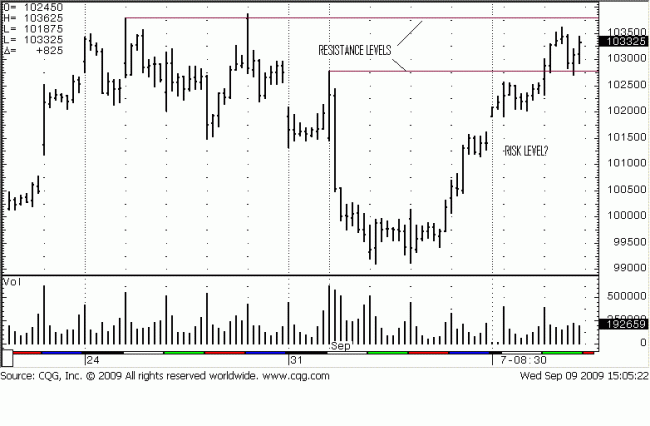
Yesterday, we showed potential resistance at the 928 area from which price delined
down on the widest range and strongest selling volume in weeks. It has taken
price six trading days to recover the drop of the single day, back on 1 September.
Getting back to what is “normal,” normally, a labored six day rally after a single day
drop is considered a weak rally. Plus, the weak rally was going into an area of
resistance, starting at 1028, and again at the previous high 1039.
One thing successful trading does not entail is going long just under a resistance
area, especially when there were no clear signs of strength to take a long position
at a lower level, in what was then not a positive buy area.
Clearly from the chart, price did rally above the 1028 resistance to 1036, just under
the next level of resistance. It can be seen from the 4th and 5th bars from the
end that the ranges, in going into the 1036 high, were small and the closes wer on
the lower end of the range. The smallness of the ranges tells us sellers were present
and prevented the range from extending higher. The close under the mid-range of
the bars confirms that sellers were present to push buyers lower on each bar,
indicating sellers won the battle of each bar. In fact, the next bar, third from the
end, led to a sell-off. This is what one would expect at a potential resistance area,
and market activity reflects the weakness. The sell-off bar range increased, and
price closed at the low end of the range. Sellers were winning. What was missing
was volume. The selling succeeded not because sellers were stronger, rather buyers
were taking a breather. One cannot know this until price rallies as it did, but
expectations for at least a “normal” correction, maybe back to 1020, or 1015, but
that never happened.
The last two bars show a recovery rally, yet the volume on the rcovery rally is not all
that great. It is the absence of sellers that allows lower demand to continue
making headway, and this has been the tenor of this rally since March.
The question about defining risk is very valid. Trades are less defined by their profit
potential than they are by the initial risk exposure. As already stated, there is no
reason to buy just under resistance. If one were to buy on the breakout above 1025,
the immediate potential stopping area just 300 tics higher, but the risk is back under
1015. Risk $500 for a potential $150? And now 1028 holds, but what about 1038,
where price just recently failed? It could fail again!
Buy at 1028 with potential resistance $500 higher, and the risk is still under 1015, or
$650. That is financial suicide money management. This has epitomized the plight
of trying to find a reasaonable risk/reward position in the S&P. The stops in going
long are higher than the potential identifiable profit.
Now we have to see how price negotiates the last failed high at 1038 to determine if
a potential for a profitable trade exists.


