Monday Evening 21 December 2009
As Yogi Berra would say, “It’s deja vu all over, again.” The trading range
continues, as we figured it will, at least for December, but…anything can
happen. Those last three words are probably second in importance to knowing
the trend. “Anything can happen,” usually happens when least expected, and
very often when it does, it happens with a vengeance.
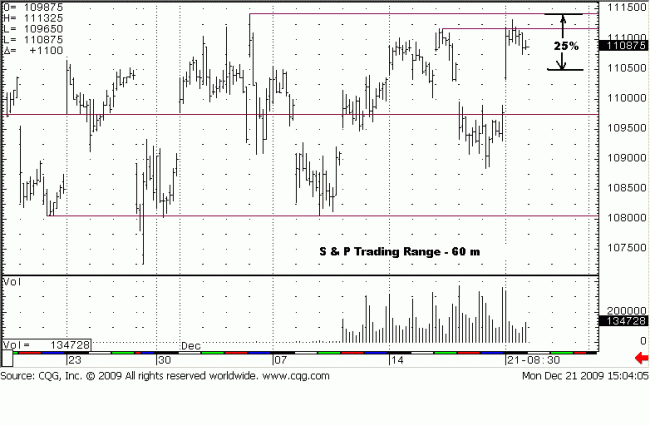
Today’s chart is an intra day 60 minute one. For our purposes, we use day
session only price data, and it suffices. The current trading range has been in
progress for over a month. Each time at the highs, buyers have carte blanche
opportunities to run away to the upside with this market. Each time, it just
does not happen. There is not enough demand buying to break the stalemate.
We discussed supply selling in S & P – Trading Ranges And Bubbles,
6th paragraph. Demand buying is the opposite.
Demand buying is noted when there is a wider, or series of wider trading
ranges, on substantially increased volume, and price breaks out of a previous
resistance area. This is differentiated from regular buying activity that occurs
every day in normal activity. Demand buying is also different from
short-covering, also a different kind of buying activity. Each have their own
characteristics and place in various chart scenarios.
If you were to gauge the heaviest volume activity of the last several trading
days, today’s was almost average, a shade under. Look at where it occurred:
at the top of the trading range. What this tells us is that there was a lack of
demand buying. How do we know this? Price did not extend itself up and
beyond the resistance high of the trading range. Demand activity would have
shown the heaviest volume and wide ranges extending higher.
Trading ranges are different animals. They require the opposite of normal
trading, which is to buy on strength and sell on weakness. In a trading range,
one has to sell apparent strength and buy apparent weakness. Today, we sold
apparent strength, primarily because resistance keeps containing and repelling
rallies, and for the lack of demand, as discussed.
There is another reason. In a defined trading range, as this one clearly is,
one of the least risky areas to sell is the upper 25% of the range, just as one
of the least risky areas to buy is the lower 25% of the range. We have
identified the upper 25% on the chart, between 1105 and 1115. We sold 1108
late in day when price closed under the day’s trading range, second bar from
the end, on increased volume.
The close was under the five previous 60 min bar closes, and the fact that
volume increased tells us that sellers were more active that buyers, based on
results of the poor close. If you note the 5th bar from the end, it was a probe
to go higher, but there was no volume effort behind it. There is an example
of mere buying activity as opposed to demand buying.
We can be wrong on this, and demand buying can rush in tomorrow, but we
have to go on what we know, and what we know is that price failed to go higher
on weak demand in the upper 25% of a defined trading range. If we are wrong,
we will be wrong for the right reasons.
There are a few other caveats attendant with this trade. Price remained in the
upper range of the entire day without selling off, despite increased volume on
what selling there was. The other one is the age of this trading range. The
further along the right hand side of a developing trading range, the closer it is
to a final resolution. Trading ranges try the patience of most traders, waiting
for a directional move to get underway. We have characterized this
development more as distribution, rather than accumulation. The latter would
lead to an upside breakout, but demand has been absent. With a lack of
demand, the only thing keeping price up is an even greater lack of supply
selling. If any amount of supply selling on increased volume entered the
picture, price would fall hard. For now, we deal with what is.
What is, for now, are the high end of the trading range, resistance, and the
lower end, support around 1080 – 1085. Until broken, we get to use them as
a trading guide, much as we identified a channel in the British Pound,
yesterday, British Pound – How To Cover A Short Position In ANY Market.
Starting with the 9th paragraph, we discussed how channel lines can act as a
guide, but it depends on HOW price approaches and REACTS to them.
In the S&P, price approached the upper resistance line in a WEAK manner.
The REACTION yet remains to be seen. We draw this comparison to show how
the tools of trading, using price and volume activity, are the same no matter
how varied the circumstances. The markets always adhere to the unchanging
principles of supply v demand.
We know for certain that price is on a trading range. We also know for
certain HOW it was just retested. We also know for certain that trade location
is very good. Now we get to await the uncertain results.


