Saturday 24 October 2009
Short positions were recommended on Wednesday’s decline at 1080. Stops
are at 1099. The question for Friday’s trade was whether or not the failure
highs would be challenged again and exceeded, or if there would be downside
follow-through?
Given the manner of this fiat currency-induced rally with the Fed pumping in
money through Permanent Open Market Operations, [POMO], since the March
bottom, it is unlikely that the market will be allowed to just roll over and sell-off.
Interfering political interests, meddling in “free market” operations, [to the
extent that free markets can be believed], does not want to see another stock
market drop amidst all the other probelms that created the preciptious drop in
the first place. With that “fundamental” point of view as context, we return to
reality of interpreting market behavior through price and volume, aka the final
arbiter of ALL opinions, whatever the source.
Friday’s early trade looked postured to continue rallying after news of a
company’s earnings were released. To indicate the extent to which the
financial news media is willingly used to promote bull-mania, programming was
interrupted with “Breaking News” to annouce the better-than-expected-earnings
and puff up how good it would be for the market. Pure hype tripe. The “rally”
was short-lived.
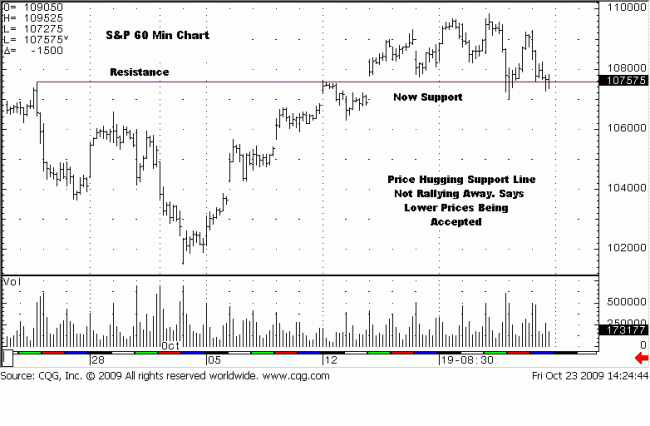
We only use day session price information, by choice. The 60 Min chart shows
how price opened on a gap up, [6th bar from the far right], on what proved to
be the highs. After the first 30 mintues of trade, price made one more final rally,
and then began to fall, steadily. Looking at the market structure, it looked like
if price dropped to 1086,it would not stop there, and the tenuous-looking short
position from 1080 would become more secure.
The horizontal “Resistance” line, drawn from the left side of the chart and
extended to the right side “into the future,” started from the 23 September high
at 1076. We say “into the future” because that line will continue to act as
resistance, as it did on 12 October, and once price rallies and stays above it,
the line then acts as support, as it did on 16 October, 21 and 22 October, and
then again on Friday, the 23rd. It looks like price is returning to the support well
a little too often. The more a line is retested, the more likely it will fail. Follow
the logic.
Price first broke the resistance level on 14 October’s gap higher rally. It
retested the breakout two days later. Note how on the first retest, price was
strong enough to stay above the line. Price then rallied to new highs. The
next retest, the last hour of the 21st, and the opening hour of the 22nd, price
penetrated the line. [Note how price never closed under it.] This shows a
weakening of the trend. Look at the character of the subsequent rally. It
formed a lower high after making a lower low for the first time since the
begining of October. This is another sign of market weakness that can lead
to a change in trend.
On Friday, a third retest, and price continues to hang around the important
support line. By staying close to the line, we know that lower prices are being
accepted, and that will lead to further declines. How do we know this? Compare
the way price moved away from the new support on the 16th. It moved higher
and away, quickly. Not any more. It has been hovering there now for three
strainght trading days.
Could this analysis be wrong?
Yes. There are always two sides to any scenario, and it is folly to have a bias
and discount what may be contrary to one’s favored point of view, even those
that are all based on observed facts. This is what the facts are indicating, as we
see the. We mentioned the “fundamental” context ealrier in that the politics of
the market will not let go readily. It could be that support does hold, and the
market mat remain in a trading range bound by the 1100 high area, and the
low 1070 area.
What you see here is the present tense battle between the forces of supply
and demand. Right now, they are somewhat in balance with the edge going
to supply by virtue of current price location. Here is a prime opportunity for the
forces of supply to step in and take control from a weakened demand. That
opportunity is now, immediate. If sellers cannot keep pressure on the market
as buyers are backed to the wall, [or support, in the instant], it will signal
buyers to keep on and regain control from an unwilling, or unable force of
selling.
It is that simple.
A big clue, and maybe the clincher, will come on Monday. If price sells off and
makes another new low under 1070, and holds, it will be a second lower low,
after a lower high. That will definitely change all the intra day trends lower,
and it will put the daily trend in a change from up to at least sideways.
As an aside, there has been a study made on Decennial highs in the stock
market occurring in years that end in “9.” This is recall, and the study years
are not fresh, but 2009 qualifies as a market high year. The odds favor the
high for the year is past tense, less than a week old. Present tense market
activity, as we have related the factual observations and applied simple logic,
is supporting that study.
Market position: short from 1080 with a 1099 stop, [which can change at any
time, depending on the developing activity on Monday]. Price objectives reach
to the 1020 leve, but there is the immediacy of 1070 that needs to be resolved,
first.


