
Recovery versus Bull Market
by: Fernando Gonzalez, EvolutionTrading.net
What better method could there be to test any stock market’s systemic risks than to experience a real, substantial collapse and thereafter measure its ability to quickly recover? Well, for the purposes of that examination, we are in luck. On the other hand, for the purposes of properly expecting what we are experiencing this year as a “new Bull Market,” perhaps not yet. While most of us are well aware of the downturn that hit the markets hard in 2008, it was really in 2007 where nearly all global equity markets peaked. 17 months later (on the global average), no equity market was spared and all had fallen into the abyss, with little or no hope for recovery any time soon. The damage was substantial: the S&P500, the mightiest of all stock market indices had lost more and faster than it ever had in its 50-year history, just short of 60% in 17 months.
As abrupt as it began, all that damage ended right around March 2009: the markets one day pointed up, and have barely stopped ever since. In fact, global markets have been rising so fast in the months since March, that they are moving UP at least as fast (and in many cases FASTER) than the rate at which they were moving DOWN since the peak in ’07. Who could have known? Not I. As the S&P500 now enters the epicenter of the 2008 decline, let’s assess how the rest of the global markets have performed in comparison.
In the table below, we assemble global stock markets classified via the FTSE Global Index Series, and measure the corresponding extent to which they have recovered the damage from their respective peaks (around the 2nd half of 2007) to their respective low points, most of which occurred in early 2009. The process of classification assembles the countries into 4 groups: Developed, Advanced Emerging, Secondary Emerging, and Frontier. For the purposes of our examination we have omitted the Frontier series, as the markets in those countries, if any, are still quite under developed. Let’s take a look:
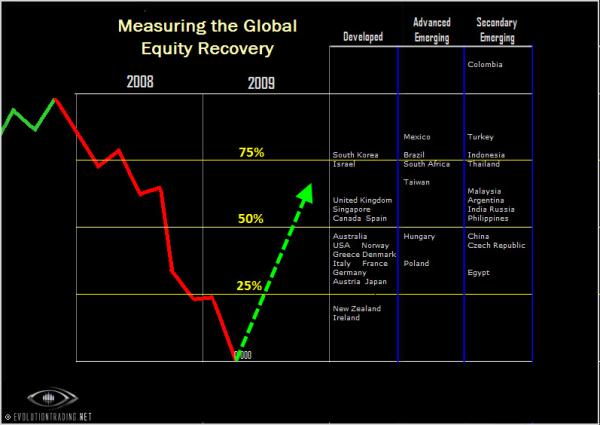
If we were to study the Monthly charts in all the stock markets listed above, all would reflect a massive decline that began commonly around the second half of 2007. All of them would also reflect the beginning of an upward leg that still extends to this day, beginning right around March 2009. They would all have similar trend structures in that regard. While the actual individual percentage loss or gain from each market differs greatly, let’s note that what we are examining here is extent to which each one has recovered their respective damage, where 100% would represent complete recovery. The 3 columns on the right group the countries into their appropriate FTSE classifications: Developed, Advanced Emerging and Secondary Emerging. The 25, 50 and 75% recovery levels are delineated in yellow above, while each country’s position on the list relative to those yellow lines reflect the % of its recovery in comparison to its damage – the HIGHER a country is on the list, the GREATER and STRONGER its magnitude of the recovery.
We will note that there are many countries that, in only about 7 months, have recovered much more than half of their losses already, which, on the average, took 17 months – that means that in many cases, the rate at which many of these markets are recovering faster than the rate at which they had declined. This is quite an impressive development in light of the foreboding outlook we experienced not very long ago.
Below is a short list of some of our favorite Global Stock Markets based not only upon the magnitude of their recovery, but also in observing how compliant or “easy” they were to decline in the first place. In other words, in developing our list of “promising” future markets, we take a “last to decline-first to recover” viewpoint, based upon analyzing their respective long-term (Monthly and Weekly) charts:
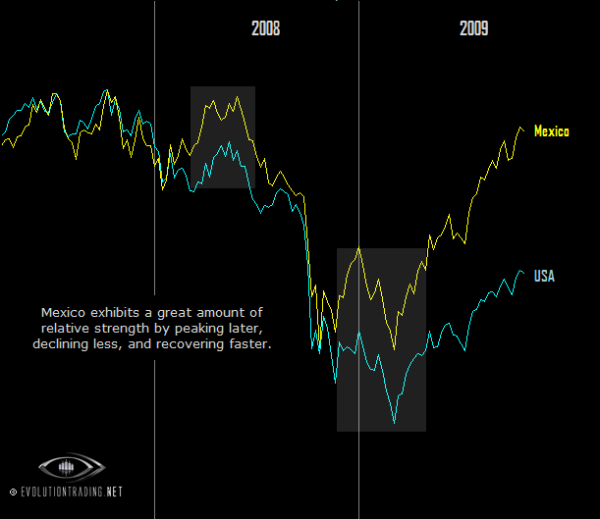
MEXICO. Not only is Mexico well-classified by FTSE (Advanced Emerging), but the fact that this market did not peak until May 2008 is a significant example of relative strength (see shaded box below). It did not decline until well after most equity markets had already began their downturn. This “early” relative strength is solidified by the fact that it is now “podium spot” on our Recovery table above: Mexico has recovered over 80% of its 2008 damage, and with relatively fast speed as well. Let’s take a look at it:
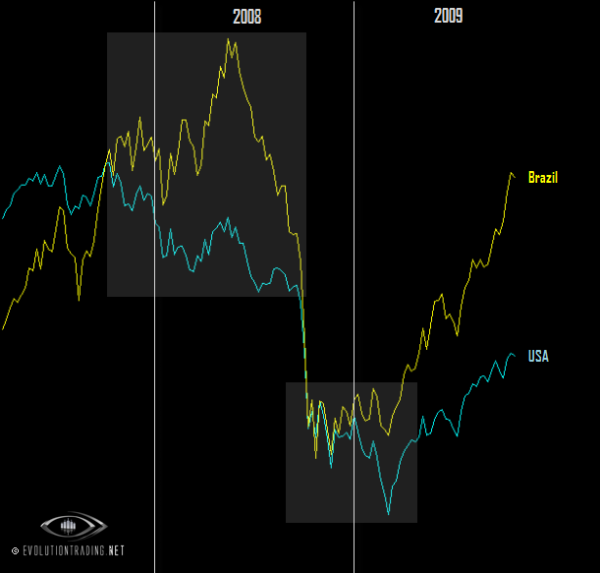
BRAZIL: Similar to Mexico, but more volatile, Brazil’s Equity downturn only lasted 5 months (compare to 17 months):
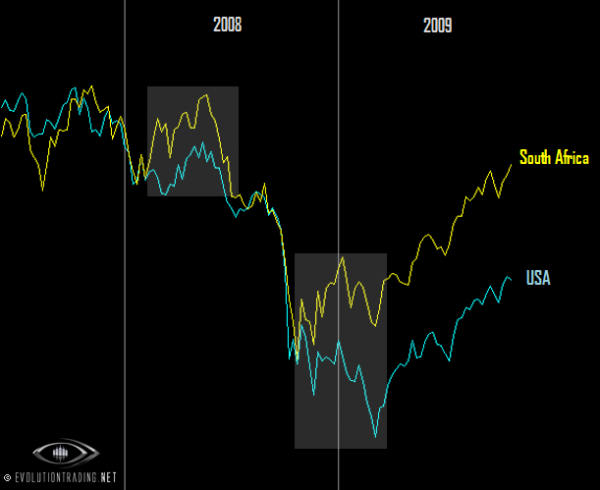
SOUTH AFRICA: The South Africa market lost approximately 40% in 5 months before it bottomed, compared to almost 60% over 17 months before bottoming in the S&P500:
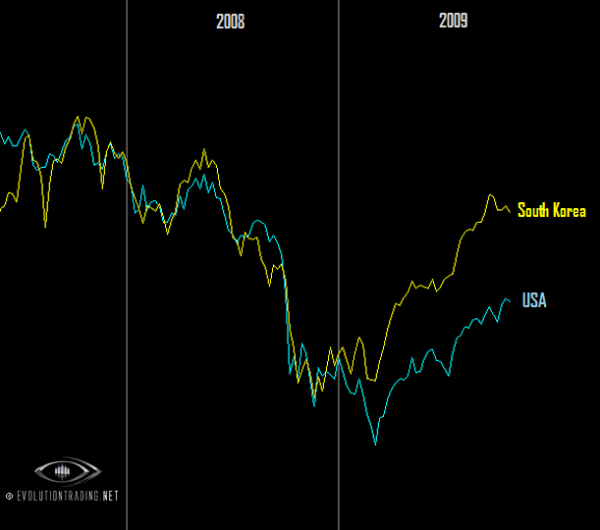
SOUTH KOREA: Although the structure of South Korea’s peak-to-trough movement from 2007-2008 is very similar to that of the S&P500, it is our favorite among all the developed nations, since it possesses the strongest, and most stable recovery phase. Notice that South Korea bottomed a good 6 months before the S&P500 did. As of today, it has recovered over 70% of the damage – the mightiest recovery of all the Developed Nations:
While our examination today yields some promising results for the future of global equity markets, in fact many of these markets doubled since their lowest points, the question of whether this recovery can be sustained enough to properly label it a “a new Bull Market” is quite significant at this point in time, specifically. Let’s see, if it took about 17 months for the damage to be done, wouldn’t it make sense to allow about the same amount of time before we come to a plausible conclusion that the “markets have completely recovered?” As impressive as the developments of the year 2009 are (so far), it would be premature to say, with any reasonable degree of confidence, that the Global Equity Markets “are in a new Bull Market state.” Strange, but some of these markets, including the US, can proceed all the way to new, all-time Highs, and while we can call that “ fully recovered” it would still be difficult to label it a full “bull market” – an unstoppable multi-year environment to unimaginable heights. Reason? Few are aware, and even fewer will remember that in the mid-sixties and throughout the next decade or so, equities experienced a few “bear markets.” Each one of these was followed by a move to an all-time HI. The problem is, every time the markets moved to a new all-time HI, it was then followed by a new, multi-year LOW. In other words, the markets “fully recovered” the damage every time, however this was only a precursor to a move to new, multi-year LOWS. It took the markets almost 2 decades between the 60’s and 70’s to sort out what we now see clearly in hindsight as a market that was neither Bull nor Bear: it was quite a difficult and confusing era. It was not until the summer of 1982 that a clear, “new” sustainable, awesome and unstoppable near-20 year bull market began.
While the markets of this generation are very unlikely to “perfectly” repeat the 1960-80 era, what is similar is the fact that this generation is a fast “ping-pong” game between “brief and unsustainable” Bull and Bear markets. Perhaps the awesome global equities we note above are the future leaders of the next great Bull Market (“Mexico?” Some might ask…)., at this point in time, the stake and risks are quite high to look for sustainable continuation. Perhaps it will take a decade (if we count from year 2000, then that would mean it is almost all over), or perhaps, like ’60-’80, it will take two decades. Regardless, when a REAL bull market is here, and there will be plenty of time to properly recognize it, these markets are likely to move to heights only few can imagine… it would be sensible not to jump the gun though, as some “old and wise” investors of the past might warn.
____________________________________
DISCLAIMER:
This body of work is written for educational purposes only. Its contents are not intended to recommend, advocate or urge the buying, selling or holding of any financial instrument. Trading and Investing involve high levels of risk. The author expresses personal opinions and will not assume any responsibility for the actions of the reader. The author may or may not have positions in Financial Instruments discussed in this newsletter. The terms “buy signal,” “sell signal,” and others are commonly used terms in Technical Analysis, and do not serve as instructions to take any action. They are purely for academic purposes. Evolution Trading and Evolution Investing urge their readers, visitors and students to perform independent due diligence and plenty of research before making any financial decisions. Future results can be dramatically different from the opinions expressed herein. Past performance does not guarantee future results.
© Evolution Trading 2009 All Rights Reserved.

