Thursday 20 May 2010
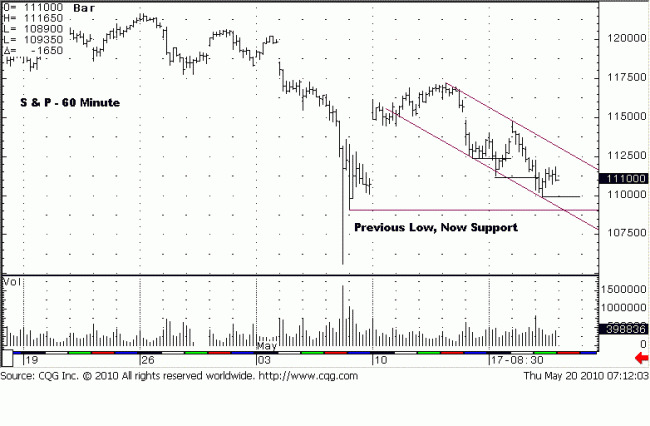
This has become a difficult market within what seems to be a downtrend. After
several days, since the 13 May reaction rally high to 1170, price has clearly been
dropping, but the net declines have become a bit smaller on increased volume
effort. Within the downward slanting channel, we have drawn some horizontal
lines at each swing low.
The daily volume over the last four trading days has increased, yet the net
downside results keep shrinking. What that says is for the increased effort,
volume, there is less ground gained when there should be greater gains
resulting from the added effort. From the 1113 low on the 17th, price made
an impressive rally to 1147. It was short lived as the ensuing decline steadily
eroded those gains into yesterday’s sell-off low of 1098. Price broke 1100, but
the rally back to 1118, just like Tuesday’s rally, turned the intra day trend, on a
smaller time frame, up.
It looks like price may rally to the upper channel resistance line, but when
overnight activity is added, the opposite happened. Next chart.

The overnight activity has been added to show what has developed pre-opening
for Thursday’s session. The low from 7 May, 1090 area, becomes potential
support in the future, which is what the horizontal line represents. It converges
right in to the support lower channel line. That lower channel line represents an
oversold condition, which may act as support. As we write, it has been holding.
However, a report came out at 7:30 a.m., CST, and price dropped even further,
to 1085.
What to make of all of this? We have been on the side lines since covering
around the 1130 area, and the conflicting intra day activity had us looking for
a retest rally, perhaps to the 1150 area, but price is over 60 points lower.
What happened?
The focus was put on how the intra day activity kept showing a resiliency, but
also an inability to hold the gains. Shorter time frames are subordinate to
higher time frames. The daily time frame did not give any indication of a
market turn. This is an example of how putting one’s focus on the wrong time
frame can lead to a wrong read of the higher time frame.
Price is in another zone of support. Odds favor the 1080 area holding, at
least initially. One cannot sell into the proverbial hole, for the risks are too
great. Our expectations are for a trading range to develop, but we have
maintained that over the past week. Instead of letting the larger time frame
be the compass for price direction, an opinion, based on smaller time frame
activity, colored what MIGHT happen, as opposed to what WAS happening.
The larger market message has been clear. We listened to the static and
missed some opportunity. The trend is the most important piece of
information. How many times has that been stated here?! See how easy it is
to get sidetracked?
For now, we are waiting for some kind of anchor from which to take a new
position.


