

Since we last published our “picking tops” article for TraderPlanet on August 2, sentiment levels were at extremes with a 98% bullish reading. We were looking for a top then and the S&P 500 (SPX) dropped from 1709 to 1627 in one month.
We had a 2% bullish reading on September 3 as the SPX was about to touch a support line. Support held and the SPX has rallied some 60 points off those lows. How far will it go from here?
TWO KEY PATTERNS
The best way to measure your entries (if long side) is to measure risk/reward. It is hard to determine when sentiment will reach extremes again, so the first thing we want to do is look at the charts. There are two patterns and wave counts that are standing out right now.
- The SPX could be making a move to the top of a bearish rising wedge, which would be wave E (the final wave) before breaking down. That is of course, if it follows that pattern. But if it does, the bulls would have about another 30 points to the upside (reward). But the target for the pattern on the downside is the 1575 area (risk)
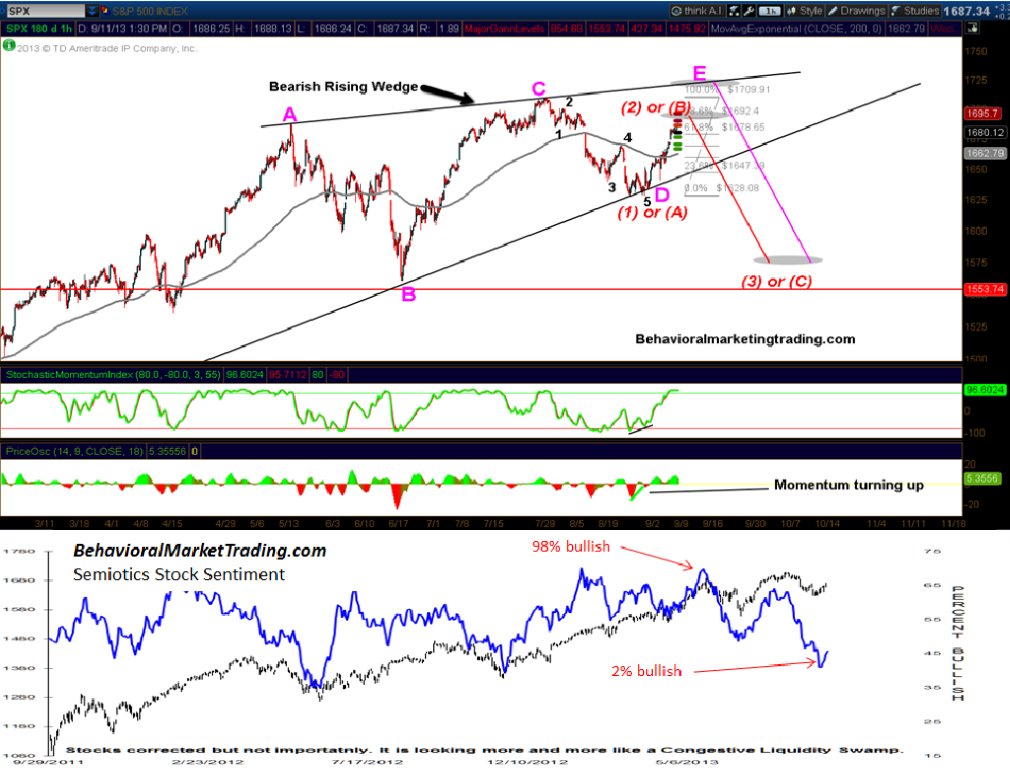
- The SPX could either be in a wave 2 or B up, (current move up) with wave 3 or wave C down pending. For this pattern to play out, the SPX would have to turn down immediately. The risk/reward for the bulls is very lopsided with this pattern-as reward would be a few points (1692ish) and risk would be many points down.
THE BOTTOM LINE
Of course it’s up to the markets to determine whether these patterns will or will not play out. But by measuring potential risk reward is a great way to determine whether to make the trade or not.

