In periods of market weakness, no matter how large or small, I try to find the bright spots in the sea of chaos. Whether it is the bond market finding its footing or in this article’s case – small caps outperforming large caps.
BAROMETER TO WATCH
The iShares Russell 2000 ETF (IWM) can act as a great barometer to risk taking within the equity market. It makes sense that we would see investors chasing after small cap stocks in their attempt to add beta to their portfolios or find the last drips of juice to squeeze in their desire for capital appreciation. Going into market slumps we can turn to IWM and its relative performance to the S&P 500 to see which is leading – small caps or large caps. We can use our trusty Relative Strength Index indicator to get some forewarning to a possible shift in relative performance between the two style boxes.
CHART ACTION
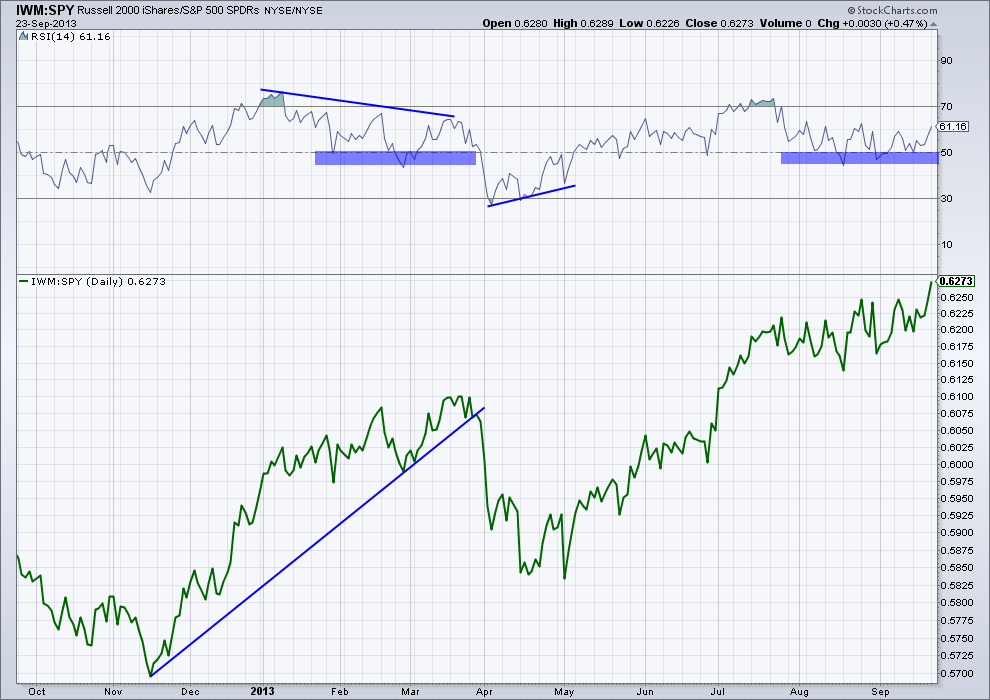
A great example of this was in early 2013 as the chart below shows. We saw IWM outperforming SPY as the green line rose for the first three months of the year. However as the RSI indicator shows in the top panel, there was a divergence taking place in momentum. We eventually saw a slight correction in March and April with SPY strong-arming its small cap colleague as RSI broke through support around the same time the ratio between IWM and SPY broke its rising trend line. However the outperformance by large caps (via SPY) didn’t last long, we saw another divergence, this time in IWM’s favor in April as the RSI began rising against the headwinds of a falling IWM:SPY ratio.
COMPARISON
Now we can fast-forward to the last two months and what’s been happening between IWM and SPY. While there has been a slight drop in the Relative Strength Index we have yet to see a break of support in the momentum indicator. This has helped keep IWM outpacing SPY, even taking it to a new high with Monday’s price action. What’s important to note here is that we can’t jump the gun when we first see a divergence in momentum. Just because we have an ‘overbought’ RSI followed by a lower high does not mean we will see a trend change in the immediate future.
THE BOTTOM LINE
While the S&P 500 is off its high there are still some pocks of growth and outperformance taking place in the current market environment. It’s not up to me to decide how long IWM will outpace SPY, but as I’ve mentioned above, we have the tools to look for a break and see if a trend changes comes to fruition if and when it happens.
Disclaimer: The information contained in this article should not be construed as investment advice, research, or an offer to buy or sell securities. Everything written here is meant for educational and entertainment purposes only. I or my affiliates may hold positions in securities mentioned.