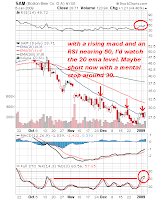
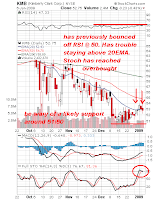
I thought it might be beneficial to show those interested one of my methods for finding playable stocks. This method involves going to Stock Charts’ Stock Scan (link also in the sidebar under ‘Important Technicals’) and scrolling to the bottom, in the Point and Figure section. It doesn’t really matter which filter you choose. Make sure you’re shorting bearish stocks and buying bullish stocks, though. In this instance, I chose ‘Descending Tripple Bottom Breakdowns.’ It’ll give you some stocks that show this pattern, and I chose a few that had a price over $10. You can go with the penny stocks, if you like, just be aware of their risk, and the fact that you may not be able to short something under $5 if you do not have sufficient capital.
Grab a few of those stock tickers, put them into the Candlestick Chart form. Add some useful indicators like RSI, MACD, Full Stochastics, 20/50/200 EMA, etc. Then do a comparison between the PnF and Candlestick charts. I’ve done most of the work directly on the charts below. My favorite out of the three is probably UTI. But I would be careful with any of them, as the market is in bear market rally mode. All three definitely look good for a short on overall weak market days.
 |
 |
 |
 |
 |
 |
Use caution. Take responsibility for yourself. Remember risk management is number one!
PS: Downloaded Think of Swim’s software to do some paper trading practice. Looks solid. Thinking about posting some results as I progress.


