

I’ve been a very profitable swing trader over the years and one of the things I’m most proud of is how completely transparent I’ve been when it comes to our trading history. Even though our history has been absolutely phenomenal, I always publish all of our trades–including the ones that didn’t work out. I’ve built technical analysis algos and scans that I use to find consistent, multi-day swing trade ideas and then alert our members to both long or short positions.
One of those scans recently found TSLA as a potential short.
But before getting into that, one thing any trader has to do is examine the macro picture. We do this every night before sending out updated watch lists and videos to members. The one thing we’ve seen recently is a psychological exuberance at the new all-time highs, but also a lack of fundamental and technical support that justifies those highs.
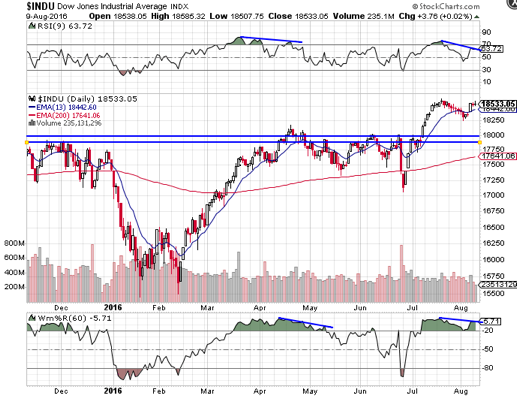
When we look at the DOW for example and break down the 9 month daily chart it’s clear we’re in overbought territory. One major takeaway from the chart below is that both the W% and RSI indicators are mimicking the April 2016 patterns before the Brexit event in June and a test of the 200EMA is probable. Our initial short term target in the DOW is 18,100. Why is that important? Because trading WITH the macro trend is one of the ten major rules we follow that has enabled us to make double digit returns every year since inception
Taking that overall picture a step further we can overlay it on TSLA where we see a few similar patterns and indications.
First, we’re coming off a failure to break into new price highs through the early summer. This is very telling as $240 failed and then $235 in June and August.
Second, new indicator highs were never eclipsed in both RSI and W% when comparing the indicators’ prior highs in April 2016. This tells us there is inherent weakness and resistance at much lower price levels.
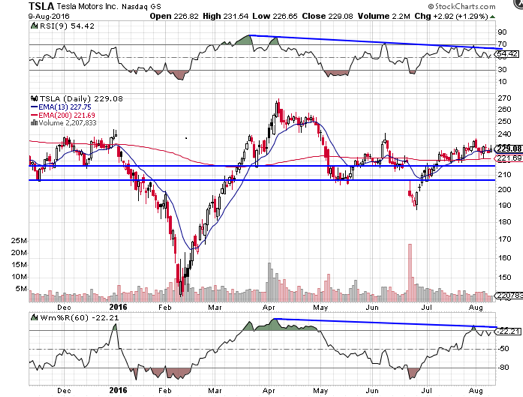
(Third, the trend in all 3; price, W% and RSI, are all down versus that high in April along with the average daily volume.
And finally, the 13EMA is continuously being tested and breached over the past 7 trading sessions only to find support on the 200EMA. This continued testing of the 200EMA is troublesome.
The takeaway: once the 200EMA is breached the stock should trade down to $210 to $205 where price levels had much higher demand and support and where the indicators we follow will be finalizing their downward trends.
Disclaimer: K Capital has no position in TSLA nor plans to open one in the next 72 hours. All opinions here are just ours and were not paid for by any 3rd party. We are not financial advisors and no investment decisions should be placed using these opinions.

