

Alice laughed: “There’s no use trying,” she said; “one can’t believe impossible things.”
“I daresay you haven’t had much practice,” said the Queen. “When I was younger, I always did it for half an hour a day. Why, sometimes I’ve believed as many as six impossible things before breakfast.”
– Alice in Wonderland.
Maybe it is a compelling case of cognitive dissonance – the ability to hold contradictory beliefs at the same time. Maybe it is proof positive that you can get people to say anything on a survey.
Whatever the explanation, this past week produced two remarkable demonstrations of unfounded optimism – surveys showing a very large majority believe the economy and their own personal economic situation is improving and they both will get even better in the future.
One, the Conference Board’s Consumer Confidence Index, is the highest it has been since August 2007. Respondents believe their current situation has improved and so have their expectations for the future.
The second, the University of Michigan Consumer Sentiment survey, shows the respondents believe the prospects for the U.S. economy are the strongest since 2004. Half expect the expansion to keep going another five years.
What Are They Smoking?
This is pure hope-ium. In the same week as those remarkable and touching expressions of faith, this was the economic reality:
- The S&P500 large-cap index (SPX) completed two losing months in a row for the first time since 2012. Volatility has increased and the daily range was greater than 1% for all but two trading days in January.
- The US fourth quarter GDP came in 13% below expectations.
- Durable goods orders for November were revised down to -2.1% from the previously reported -0.7% and the results for December were down a further 3.4%, compared to expectations for an increase of 0.3%. Business Insider described the report as “a terrible sign for the economy.”
- Earnings of large-cap companies reporting last week – notably Microsoft and Caterpillar – were dismal. Only Apple flourished, accounting for a little more than half of revenue and earnings growth for large-cap companies.
- I-phones aside, U.S. manufacturing went south; the Dallas Fed’s manufacturing index came in at -4.4, compared with an estimate of 3.0 expected
- And according to Factset, an organization which tracks market estimates, the average of analysts’ estimates for earnings growth by S&P 500 companies in the first quarter of 2015 has fallen to -1.6%. Last September the estimated growth was 9.9%
The Impact On The Markets
If you believe that this kind of unfounded enthusiasm – what the English writer Samuel Johnson called “the triumph of hope over experience” – is one of the bells they ring when the market hits the top, there is evidence to support you.
We have been long-term Bulls for several years, and we remain bullish on the long-term outlook. But we are now Bears for the short-term market and neutral on the intermediate term.
The market is showing a kind of behavior – large price swings and sudden reversals – that often occurs at major inflection points.
What We Expect This Week
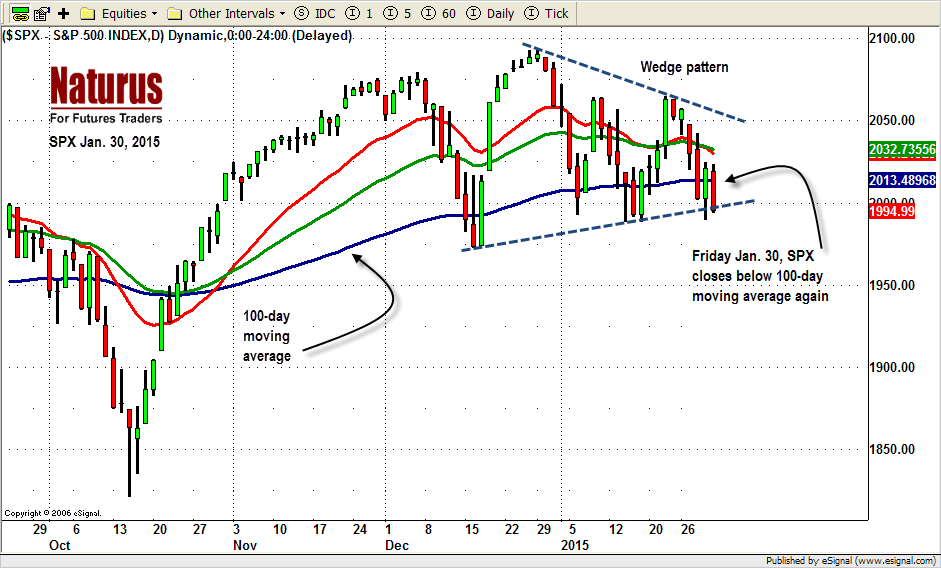
Recent market price movements argue for caution. The SPX broke its 100-day moving average line and closed below it again last week, which gave a short-term selling signal. Now 1972 will be a key level in the SPX this week. A break below 1972 could send the index down to the 1950-45 zone.
There is a rising wedge of the daily chart (see below). A break below its support will also give confirmation that 1950-45 will be the next downside target.
If the SPX stays under the resistance around 2025-50, and Bears keep pushing at the 1950-45 support, zone we could see the start of an intermediate-term correction, with the 20-month EMA around 1868 as a likely a target.
How To Trade It
We trade the S&P500 mini futures, the ES (current contract ESH5).
SPX Daily Chart, Jan. 30, 2015
Today (Monday), the ESH5 may well repeat last Friday’s trading range if overnight trading holds above 1981.25. If it doesn’t hold, overnight trading could push the ES down to 1970-68 first before the price bounces again.
If this is the case, 1985-86.50 will become a key line to watch. A breakthrough there, and a move above 1990.50 could squeeze overnight shorts again and send ES back up to 2003-01.50 area or higher near 2015-18.50.
Conversely, holding below 1985.50-86.50, and the bears continuing to fight the 1981.25 line again, could later drop ES further down below 1968.
The key level is 1981.25, which will be the make-or-break line. Watch it carefully.
Support: 1968-66.50, 1953-55, 1937-35.50, 1921.75-23, 1906.25-09
Resistance: 2016.50-18.50, 2031-28, 2046-43.50, 2062.50-64.50
#####
Naturus.com publishes a free analysis of US equity markets each Sunday. To start receiving it, please click here.

