

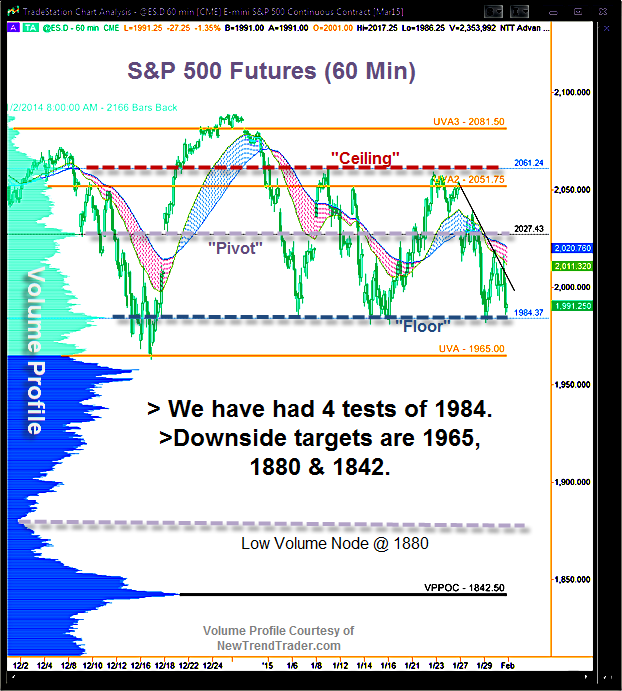
Over the last two trading days, the S&P futures have tested and re-tested key support at 1984 (aka the “Floor”). Thursday’s bounce was vigorous. Friday’s was less so, failing to surpass Thursday’s high and not threatening key resistance at 2027.
The more often a “Floor” is tested, the weaker it gets, so keep in mind the downside targets of 1965, 1880 and 1842. I would also note that the 1-year Volume Profile at the left side of the chart indicates that there is very little support between 1950 and 1880. Therefore, if we get into that zone, I would expect a rather rapid decline.
A Note on Volume Profile
The histogram on the left side of the chart shows the volume distribution in the S&P futures for the entire year of 2014 through today. Key levels are indicated by the peaks and troughs.
If you would like to receive a primer on using Volume Profile, please click here.

