

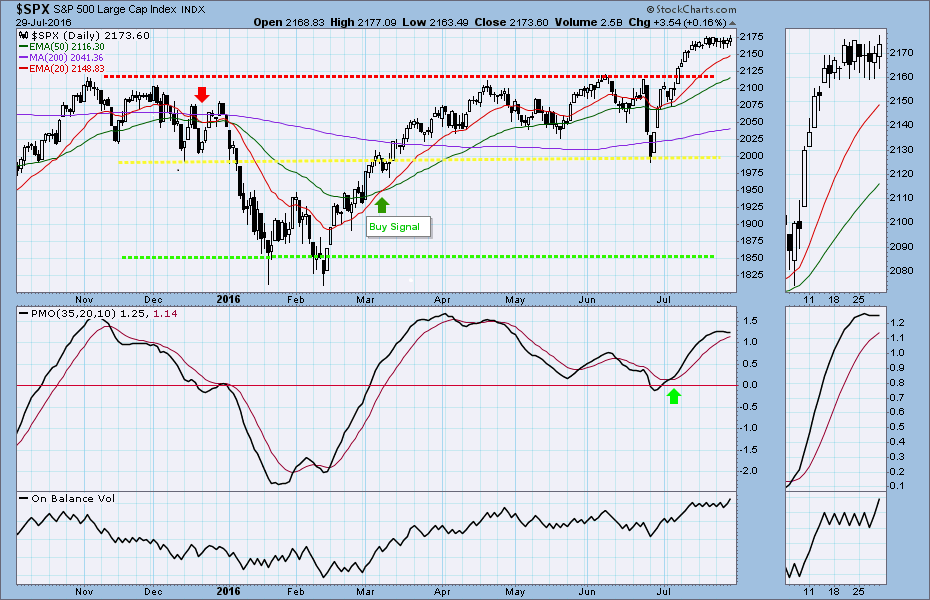
Friday was the last day of trading in July, and it ended the month with a bang: the S&P500 (SPX), the index of US large-cap companies, closed at 2173.6, a gain of about 75 points for the month.
In these glorious days of summer it’s a little difficult to remember what a winter of discontent we had at the start of the year. The SPX fell 364 point in the first six weeks of 2016, and made a low at 1810 in the second week of February.
But since then, it is nothing but up, up, and oy vey! The market has been rallying for five straight months. Every month since February has closed higher than it opened, and every month has closed higher than the month before.
So far for the year 2016, the SPX is up just a little less than 130 points for the year. And July was responsible for 57% of that gain.
(July wasn’t even the best month of the year; March was bigger).
The record high posted Friday was almost a commonplace. Another new all-time high? So what. It happens almost every week.
So what’s next?
Position traders who have tried to short this market have been slaughtered; the battle is pretty much over, and the long side has been coming down from the hills to pick anything of value from the corpses.
So you can’t short this market, especially not this close to the presidential election; anything that hints at bad news will be buried or pushed back to November or both. Since the SPX broke the 2135 resistance level, the price has been held up securely. The signs for the long term are bullish and the uptrend remains in place.
But it is tough to initiate new long positions here. The market has been in a toppy consolidation dance for 12 days as a severe over-bought condition is smoothed out, and last week it formed a doji pattern, a sign of indecision.
After a run like this, a retracement based on a little profit-taking should be expected. The first substantial support is 2150; the major support level is 2135. We expect they will hold the price up this week.
If you want to get on the long side, waiting for a retracement before you enter sounds like the best policy. The upside target should be around 2180-90.
Today
For short-term trader like us, it is much easier to get in — and out of — markets like this. The vehicle we use as a proxy for the SPX is the S&P500 mini-futures (ES), and we rarely hold for any significant period of time. If the market moves against us we exit, and look for a better entry later.
The ES is experiencing the same extended consolidation as the larger Index. Even events that would normally excite some movement — the release of the GDP numbers, the FOMC statement — had a relatively muted impact last week.
Most of last week’s action took place in a very narrow range, about 2165-2155, and the ES just whipsawed inside this range trying to shake out the weak hands on both sides.
For today, the first thing we will be looking at is the overnight trading range. Later we want to see which direction ES breaks.
For an upside move, a break above 2173.50 could trigger some buy stops and push the price up to 2183.25-86 or higher up to the 2193 resistance line.
For the downside, a move below 2150 could lead ES down to 2146 or lower toward 2135.50 level for testing. The 2135.50 monthly pivot level controls the bull trend. As long as ES holds above it, we are likely to see buying on the dips.
Major support levels: 2155-56.50, 2146-43.50, 2133-28.50, 2103.50-00.75
Major resistance levels: 2180-85, 2196-93, 2210-12
Visit www.naturus.com for more weekly analysis of gold, oil and the S&P. It’s free.

