

The Real World
February was a terrific month for the stock market, but kind of crummy for everything else. Now we have to face the ides of March, when the weather changes and the world prepares for a reset. For investors, the future is not likely to be nearly as pleasant as the past.
First, the real world, and then we look at the market. In the real economy, February was a bust. The fundamental economic reports that are supposed to drive the market were almost universally dismal. US gross domestic product, up 5% in Q3, 2014 (in part due to creative data juggling), was revised down for Q4 from elevated initial estimates to 2.2%, the slowest growth in a year.
The Consumer Price Index fell by 0.7% in January month-over-month, and fell to – 0.1% year-over-year, the first annual decline since 2009. If you buy stuff, deflation is great. If you make stuff and try to sell it, or if, like the US government, you owe a lot of money, then deflation will drive you into bankruptcy.
Business is contracting. Last week the Chicago Purchasing Managers Index fell to the lowest level since 2009 and the Dallas Fed manufacturing index fell to -11.2, after falling to -4.4 in January. The housing industry is flailing – existing home sales were down 4.9% month-over-month – and the jobless numbers are creeping up; last week 313,000 Americans filed for unemployment benefits. And of course the US oil industry, once the bright shining hope of the economy, is in tatters. The rig count has been down every week for the last three months.
About the only positive statistic is the consumer confidence index, up at stratospheric levels. But, of course, that doesn’t indicate how things are now; it measures how people hope things will be at some point in the future. Good luck with that.
The Stock Market
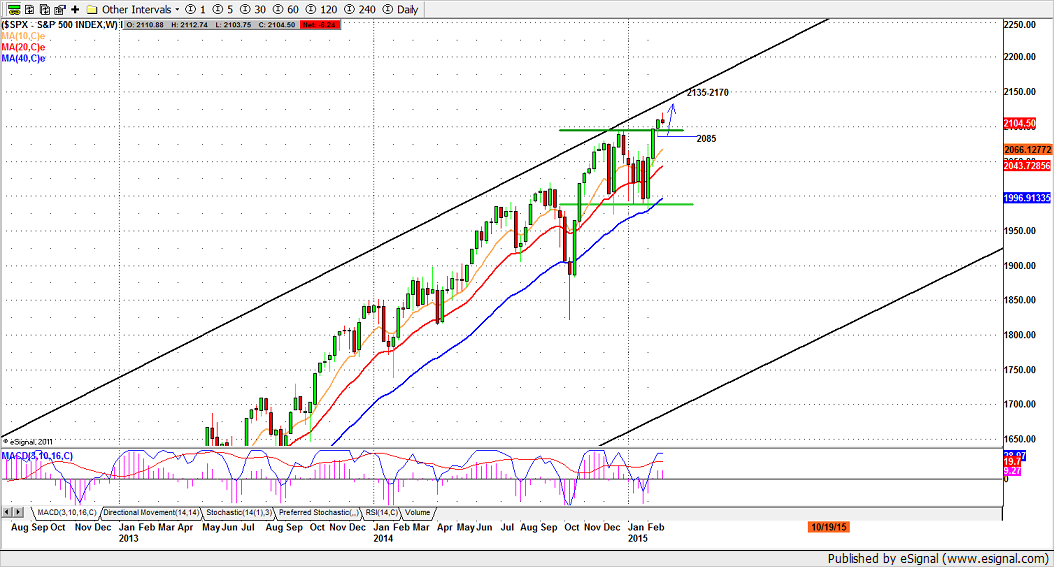
But if the real economy is sinking into the abyss, the stock market soars with the eagles. February was the best month for the S&P 500 (SPX), since 2011. The market was up 5% for the month, and it made an historic new high in intraday trading.
It has established a base above a psychologically-important level at 2100, and it looks to us like it is preparing for a new leg up in a continuing bull market. We have an initial target around 2135-2170 for this phase, with a distinct possibility of moving much higher.
And despite some minor end-of-month hesitation, in February, the large caps marched calmly, steadily higher. There were only eight down days in February, and that includes the three days at the end of the month. “Buy the dip” was the only trading strategy that made sense.
March Will Be Different
We expect March to be different, more sturm und drang and much riskier. The market may well continue higher – we are still long-term bulls – but traders who try to buy every dip better be prepared for some dramatic drawdowns.
The first thing that bothers us is the current overwhelming bullishness of investors, and the extremely low level in the VIX, the volatility index. The VIX, which is computed from the implied volatility of a basket of SPX options, is considered the gauge of fear among investors.
And right now, they have no fear. The VIX was down again last week, and it is well below the level that usually indicates intense complacency – not to say self-satisfaction – among investors.
In fact, it has been bumping along the bottom of the chart for the past two years, which is about how long investors have been buying the dips. When everybody has been bullish for two years, who is left to buy?
In addition to the unknown events that could disrupt the market this month – Ukraine, Greece, Syria, oil, and perhaps a dozen other brewing crises – there a few known elements to watch for: some significant economic reports this week; the rollover from the March futures contract into June in the second week; quadruple witching in the third week; and end-of-quarter window-dressing and manipulation in the fourth week.
All of these and more – the Fed! The Fed! – are likely to roil the markets in March. We expect to see some bigger directional moves, followed by swift retracements. Trading in index and futures options could be particularly bumpy.
Short-term Futures Action
Friday
The S&P mini-futures (ESH5) were drifting lower into the end of the month, with the intraday charts showing a series of lower highs and lower lows. The market dropped from a record high at 2117.75 last Wednesday to a low at 2100.75 – just above the psychological support – on Friday, before bouncing a little to the close.
The trading range was barely 10 points and the volume was low, as it has been throughout February. This market has been consistently making new highs on about half the “normal” volume.
Today
For Monday (March 2), the ESH5 could move in one direction as easily as the other. After the flaccid close to the month in the last three trading days last week, there is no clear-cut indicator for the next move.
The pullback in the last three days was minor, and it could easily be an end-of-month adjustment after the long rally from January’s low at 1961.50. Overall, the short-term trend is still up, and the broken resistance at 2089-85 is now the first major support this week.
Today we may see a further pullback in the early sessions if overnight trading fails to hold the ES above the 2100 level. But as long as ES does hold above the 2089-85 zone (long entry), the price could bounce back from there.
The ES also has a chance to go up first, and the price could revisit 2112.50-14.50 or higher up to 2117.50-23.50 (short entry) if 2100 holds up in the early sessions.
- Major support levels: 2092-90, 2082-78, 2065.50-68, 2050-52
- Major resistance levels: 2114.50-16.50, 2125-27.50, 2136.75-38.50, 2152.50-54.50
SPX Monthly Chart, Feb. 27, 2015
#####
Naturus.com publishes a free weekly analysis of US equity indices. To get on the mailing list, please click here.

