

The Nasdaq 100 still has not decided whether it will enter a corrective period or not. I suggest watching AAPL.
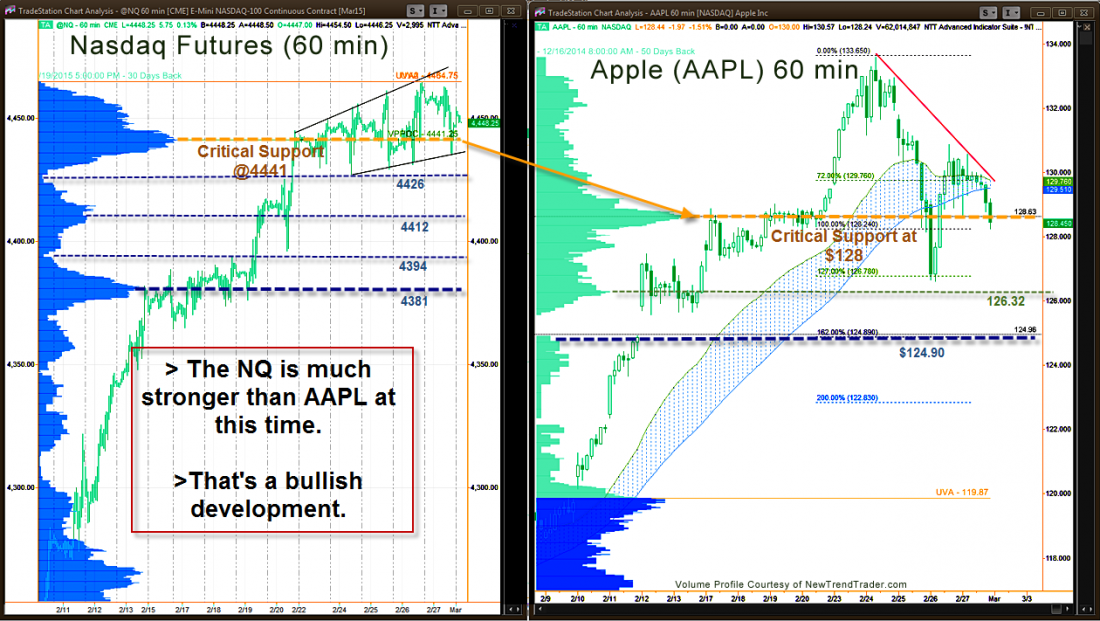
The accompanying chart shows the Volume Profile for the Nasdaq 100 (NQ) Futures for 30 days and Apple (AAPL) for 50 days. The High Volume Node at 4441 is now critical support for the NQ. It directly corresponds to the $128 level for AAPL, which is why I show these charts side by side.
Although the NQ is much stronger than AAPL right now, if AAPL were to move down to fill the gap we have been watching at $124.89, then the NQ would start stair-stepping down the indicated support levels (blue lines). This is the normal corrective process in the NASDAQ.
A Note on Volume Profile
The histogram on the left side of the chart shows the volume distribution in the S&P futures for different periods of time. Key support and resistance levels are indicated by the peaks and troughs.
#####
If you would like to receive a primer on using Volume Profile, please click here.

