

Last Week
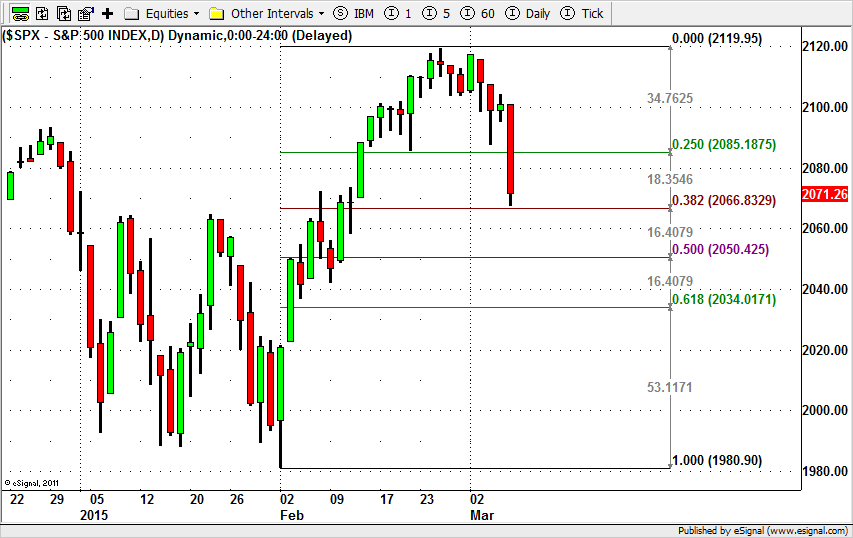
The S&P 500 (SPX), the large-cap index for US equities, closed last week at 2071.26, down 33.24 points or 1.58% for the first week of March. It was the first significant break for the market since the beginning of the raging ramp-a-thon in February. The market is now down about 50 points from the February high just below 2120.
The proximate cause of the carnage was the Non-Farm Payroll report released in the pre-market Friday morning. The number of people employed beat expectations by a wide margin (although the new jobs skewed heavily toward bartenders and waiters) and the unemployment rate was down to 5.5% (mainly due to a drop in the participation rate).
These days the markets regard goods news as bad news, because it may encourage the Fed to raise interest rates a quarter point, and the SPX sold off heavily most of the day, the biggest one-day decline since late January. There was a slight bounce for the close, but that was essentially traders exiting positions to go home flat over the weekend. In general, the price action was bearish.
Right now the index is near its short-term support in the 2065 area, the 38% Fibonacci retracement of this year’s low to high, and we will be watching to see if the next move is a bounce from support, or a continuation low.
This Week
It is hard to say if the Non-Farm Payrolls “caused” Friday’s decline or merely served as an excuse to push the prices around for fun and profit. It is equally hard to guess what bright shiny object will be next to catch the eye of the thundering herd. There is nothing much in the way of economic reports scheduled this week, if that makes any difference. These are highly speculative markets, and pretty much data-free.
One report from Europe that should be raising eyebrows is a statement from Jean-Claude Juncker, the president of the European Commission, to the effect that Europe should create an EU army to defend “European values” from Russia and others.
It won’t happen. The British, if no one else, remember how it worked out the last time and dumped all over the idea, but that it should even be suggested is bizarre. Juncker is the former prime minister of Luxembourg, which makes his suggestion sound like a scene from the movie “The Mouse That Roared.” Stranger than fiction.
Less unexpected but more dangerous is the probable re-emergence of the Greek crisis as a force in our markets. There are reports from Europe that Greece’s proposal for “Austerity-lite” will be rejected and no more funding will be provided. Greece may not be able to roll over T-bills coming due as early as Friday, and will certainly have problems with the 1.28 billion-Euro in payments due in stages by March 20.
Technical Analysis
This week 2065-60 is a key zone for the SPX. A move below that area will be negative and could lead this index to continue going lower toward 2050-2025. But the index hasn’t broken its short-term major support line yet, and we are waiting for some kind of decision.
The 135-day moving average has been holding the index up since Nov. 2013. This line is a major support line. The Fibonacci support levels of the year’s low-to-high move are about 2050 (50%) and 2035 (62%), and those support areas are likely to slow if not stop the price decline – if it gets that far.
If we see a move below the 2050 level this week, the current decline could extend to the 61% Fibonacci retracement support at 2040-35. If we get there we are likely to see some shorts covering around that area.
The 2000-1975 area is an intermediate-term support zone. As long as the SPX stays above it, the long-term and intermediate-term uptrends remain intact.
S&P 500 Mini Futures
The mini-futures (ESH5) was sharply down Friday. They broke through support and got as low as 2065.50 before closing a little higher at 72.50.
Today we could see ES drop back a little to re-test January’s high at 2067.75. A close below 2065 could cause a stop run and push the price toward 2050-55 or lower toward 2040-45.50, if the selling pressure is strong.
But the ultra-short-term chart has an oversold condition, so at some point a small bounce will be seen. The bounce shouldn’t change the downside direction, unless another official speaks out to confirm that the Fed will not raise interest rates in June. The resistance at 2104 should prevent any sustained rally until the short-term indicators get into oversold territory.
- Major support levels: 2065.50-62.5, 2050-52.50, 2036.50-35.50, 2023-20.50
- Major resistance levels: 2088.75-89.50, 2098.50-99.50, 2114.50-16.50
SPX Daily Chart with Fibonacci Retracements, Mar 6, 2015
#####
Naturus.com publishes a free weekly analysis of US equity indices. To get on the mailing list to receive it, please click here.

