
Advanced Micro Devices, Inc. (AMD) is an American multinational semiconductor company based in Santa Clara, California, that develops computer processors and related technologies for business and consumer markets. AMD’s main products include microprocessors, motherboard chipsets, embedded processors and graphics processors for servers, workstations, personal computers, and embedded system applications.
Last week we featured $AMD in our Hot Stocks Outlook which you can read more about it here.
AMD has had a very good year in 2021. The stock is up almost 70% year over year. But from a fundamental valuation standpoint it currently is pricey. It has a price to earnings ratio of 47 and a price to sales ratio of 12.5. As a broad comparison the S&P 500 has a P/E ratio of 28.7 and a sales multiple of only 3.2. This is the major hurdle facing investors and traders right now as they evaluate the prospects for AMD moving forward.
The chipmaker with the largest market share is Intel and currently, AMD’s valuation rivals Intel and many Wall Street insiders believe this frothy evaluation is not sustainable. For AMD to continue its positive trajectory it has to successfully take market share away from Intel and Nvidia. No easy task! What is undeniable is that AMD and Intel are locked in a frantic race for serve chip dominance.
Traditionally, Intel is known to deliver a higher quality product which sells for more. AMD’s strength is that it delivers a lesser quality chip but is also significantly less expensive than Intel.
Revenue for AMD is up 54% year over year to $4.31 billion and they beat Wall Street estimates by over $200 million. Earnings have increased by 78% year over year to .72 a share.
AMD has a market cap of $189.5 billion and trades on average volume of 49.8 million shares per day.
In this weekly stock study, we will look at and analyze the following indicators and metrics as are our guidelines which dictate our behavior in deciding whether to buy, sell, or stand aside on a particular stock.
- Wall Street Analysts’ Estimates
- 52-week high and low boundaries
- Best Case – Worst Case Analysis
- Vantagepoint A.I. Forecast (Predictive Blue Line)
- Neural Network Forecast
- Daily Range Forecast
- Intermarket Analysis
- Our trading suggestion
We don’t base our decisions on things like earnings or fundamental cash flow valuations. However, we do look at them to better understand the financial landscape that a company is operating under.
Analysts Ratings
The first set of boundaries which we explore in our stock study is what do the professionals think who monitor the stock for a living. We can acquire this information by simply looking at the boundaries that the top Wall Street Analysts set for $AMD. This initial set of boundaries provides us with an idea of what is expensive, fairly valued, and cheap.
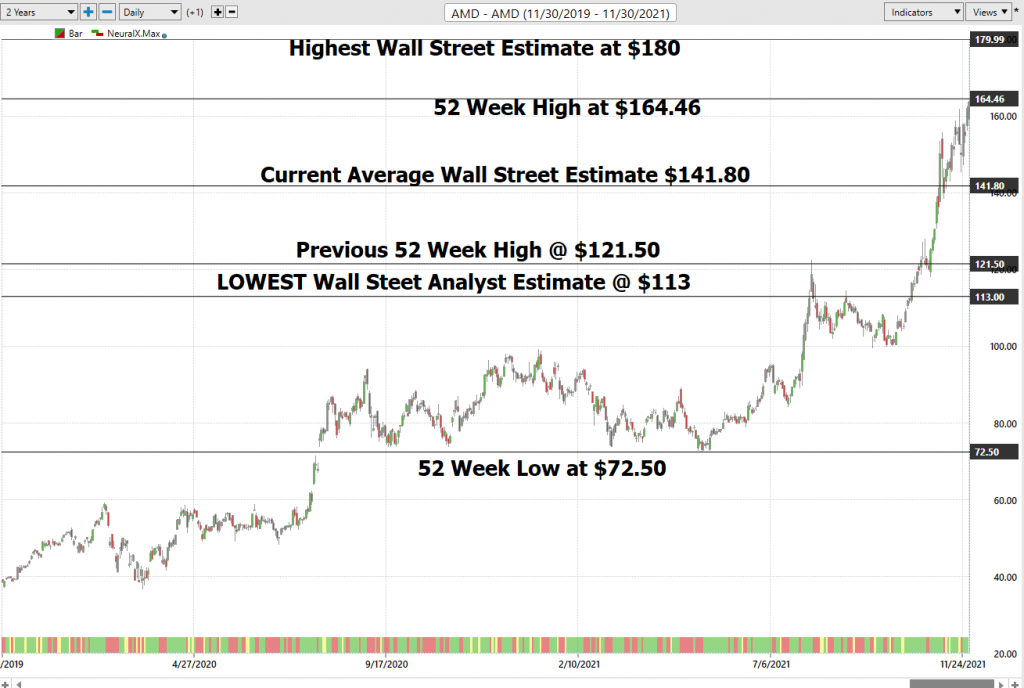
Based on 22 Best Performing Wall Street analysts offering 12-month price targets for Advanced Micro Devices in the last 3 months. The average price target is $141.80 with a high forecast of $180.00 and a low forecast of $113.00. The average price target represents a -9.87% change from the last price of $157.32.
From this simple analysis we can see that $AMD is above fair value at present time but some on Wall Street think that is has the potential to run another $23 dollars per share.
Their next earnings release is scheduled for January 21, 2022. Anticipated earnings per share for $AMD are .976 cents. For the last 4 earnings calls AMD has beaten earnings handily on each call by an average of 7.25 cents per share. They have a lot of momentum.
52-week High-Low Chart
Where the rubber meets the road as far as analysis is concerned is looking at the charts and evaluating where the asset stands in relation to its 52-week highs. As counterintuitive as it may sound, great stocks tend to consistently make new 52-week highs.
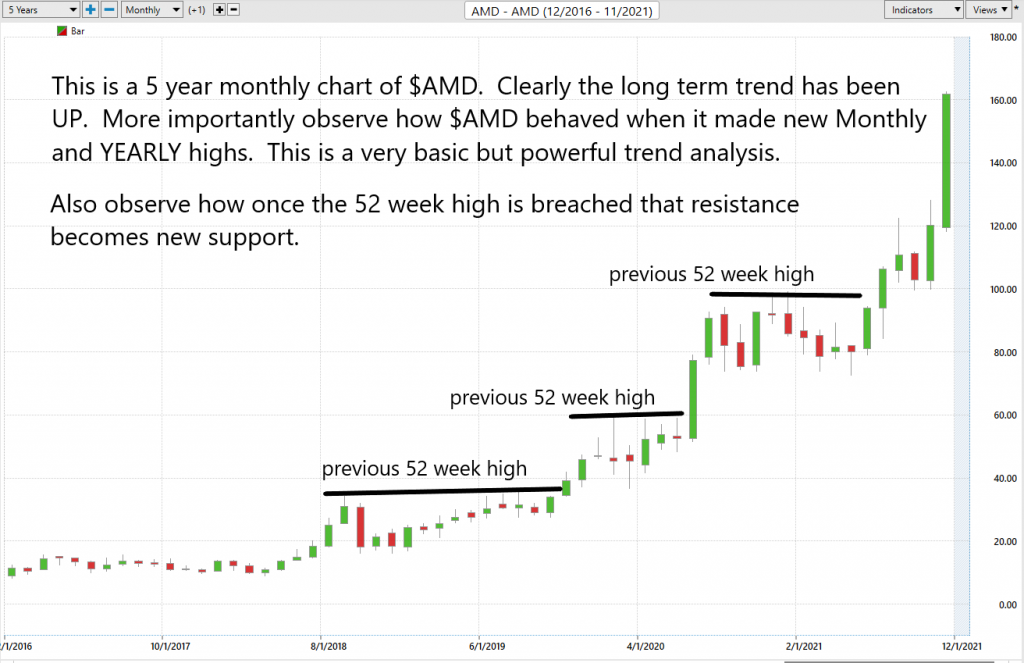
One of the simplest ways to evaluate a stock is to look at some long term monthly and weekly chart to be able to zoom out and see the big picture of the trend. Some of the greatest traders in the world use the longer-term monthly charts to determine trend analysis.
Here is a 5-year chart of $AMD. Observe how the long-term trend is clearly UP. More importantly also observe how $AMD behaved whenever it approached its 52 weeks high, and how when that zone was successfully breached the trend continued higher.
Over the last 52 weeks $AMD has traded as high as $164.46 and as low as $72.50. This provides us with an annual trading range of $91.56. We refer to these as the commonsense metrics which we use as baseline measurements of understanding normal value. When using artificial intelligence, we look to amplify our returns based upon these baseline measurements. When we divide the annual range by 52 weeks, we arrive on the metric that the average weekly trading range is $1.76. I also like to divide the annual range by the current price to provide us with a very broad estimate of volatility. When we divided $164 by $72.50, we arrive at 56%. This metric tells us that if the future behaves like the recent past it would have a very high probability for AMD over the next year, to be trading in a range that is 56%% higher and lower from where it is right now.
When we look at the 52-week chart on $AMD we can see that up until October $AMD had broken down below the lowest Wall Street Analyst estimate before challenging its most recent 52 week high. Conceptually this is a very powerful setup.
Whenever we trade, we always pay attention to where we are in relation to the 52-week trading range. It is very common to see the 52-week high provide very strong resistance to the market until it is breached. Often when the 52-week high is breached we will see the stock price explode higher very quickly over a very short period.
Stocks which breach their 52-week highs multiple times a year are often in very strong trends which we want to be aware of. The 52-week boundary often acts as significant resistance in thwarting trends. As price bounces off this level, we want to become extremely focused on what the artificial intelligence forecast is signaling.
I like to place all these boundaries, including the Wall Street Analysts Estimates on a chart to quickly visualize the history of the stock’s performance and to be able to see how that relates to what professional analysts are thinking.
Best Case – Worst Case Analysis
Next, we want to evaluate $AMD is in comparison to the performance of the major stock market indexes which we have greater familiarity with and then look at the drawdowns of the stock over the past year to get a worst-case scenario idea for any conclusions that we might reach when we trade this asset.
Over the past year $AMD is up 71%.
The Dow Jones Industrials are up 15.62% over the past year.
S&P 500 is UP 24.7% over the last year.
Russell 1000 Small Cap is up 23.66 % in the past year.
The NASDAQ is up 56.44%
You can see with Advanced Micro Devices performed substantially better than the broader market indexes, but most of those gains also occurred in the last two months.
$AMD was rangebound for most of the year and had 14 drawdowns of -7% or greater. The average of all these drawdowns was -11.8% with the largest being -21%. All these numerous pullbacks make $AMD a great swing trading candidate.
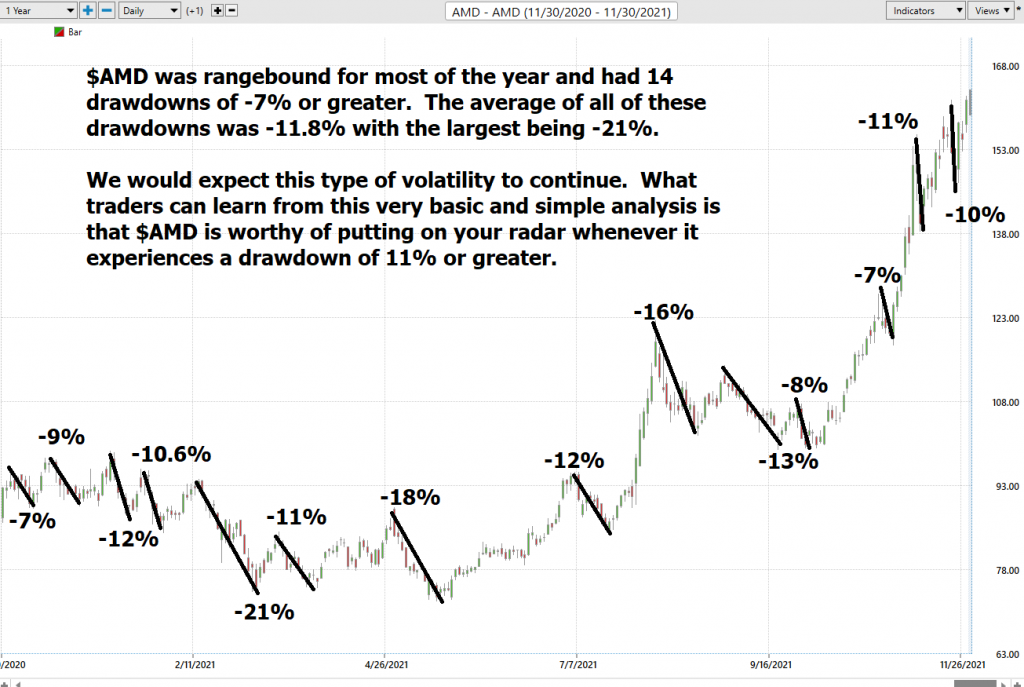
We would expect this type of volatility to continue. What traders can learn from this very basic and simple analysis is that $AMD is worthy of putting on your radar whenever it experiences a drawdown of 11% or greater.
The Vantagepoint A.I. Analysis
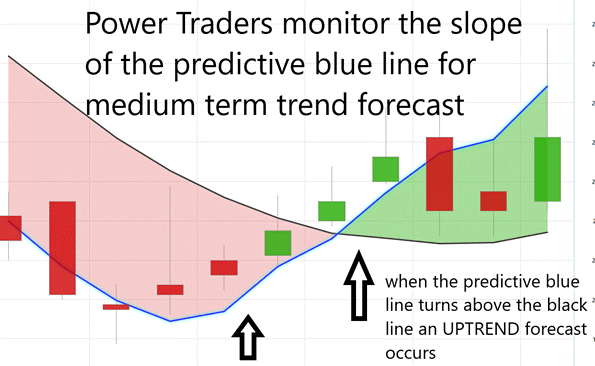
Using VantagePoint Software and the artificial intelligence, traders are alerted to trend forecasts by monitoring the slope of the predictive blue line. The black line is a simple 10 day moving average of price which simply tells you what has occurred in the market. The predictive blue line also acts as value zone where in uptrends traders try to purchase the asset at or below the blue line.
In studying the chart below, pay close attention to the relationship between the black line and predictive blue line. All that the black line tells you is what has occurred. It tells you where prices have been and what the average price over the last ten days is.
The predictive blue line, on the other hand utilizes that Vantagepoint patented Neural Network and Intermarket Analysis to arrive at its value. It looks at the strongest price drivers of an asset through artificial intelligence and statistical correlations to determine its value.
We will analyze the last six months for $AMD stock so you can appreciate the power of the artificial intelligence in a real time trading situation.
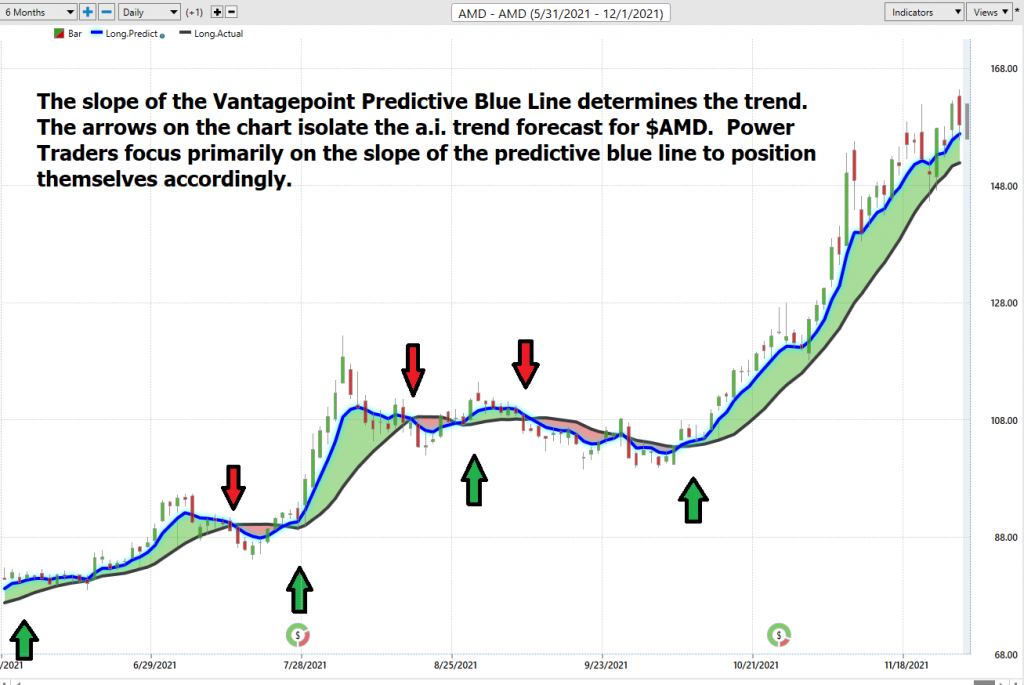
Whenever we see the predictive blue line move above the black line, we are presented with an UP-forecast entry opportunity. These are highlighted by UP arrows on the chart.
Whenever the predictive blue line moves below the black line, we are presented with a DOWN forecast entry opportunity. More importantly, there is no guesswork involved. Traders know where the value zone and trend are at all times.
Fine Tuning Entries with The Neural Net Indicator
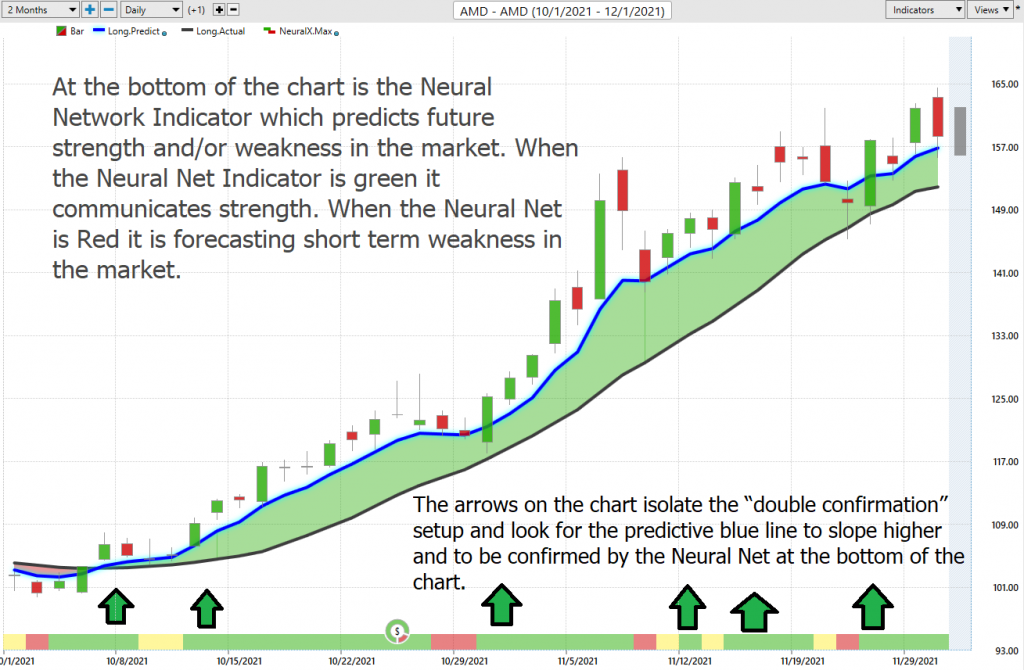
At the bottom of the chart is the Neural Network Indicator which predicts future strength and/or weakness in the market. When the Neural Net Indicator is green it communicates strength. When the Neural Net is red it’s forecasting short term weakness in the market.
We advocate that Power Traders cross reference the chart with the predictive blue line and neural network indicator to create optimal entry and exit points.
A Neural Net is a computational learning system that uses a network of functions to understand and translate massive amounts of data into a desired output, consistently monitoring itself and improving its performance.
Power Traders are always looking to apply both the neural network and A.I. to the markets to find statistically sound trading opportunities. We refer to this as a “double confirmation” setup and look for the predictive blue line to slope higher and to be confirmed by the Neural Net at the bottom of the chart.
We advise Power Traders to cross reference the predictive blue line with the Neural Net for the best entry opportunities. Observe how the slope of the predictive blue line has remained positive from the time earnings were announced.
You can see in the chart above how the Neural Net offered several opportunities of double confirmation to Power Traders, when the predictive blue line and the Neural Net aligned with the same forecast. These instances provide very high probability trading opportunities to exploit the trend.
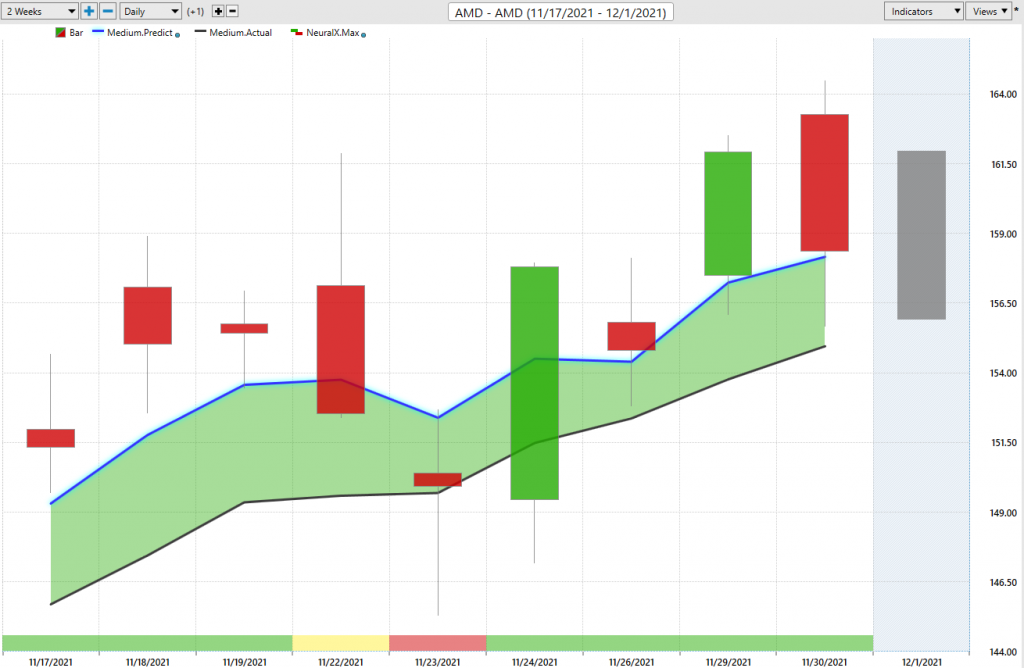
VantagePoint Software Daily Price Range Prediction
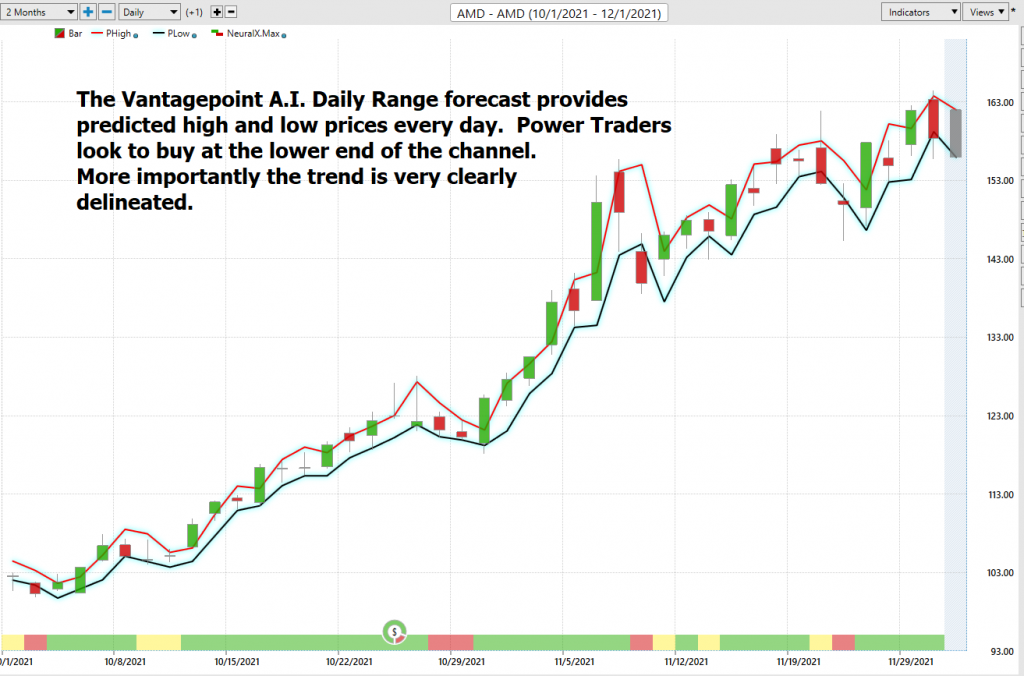
One of the powerful features in the Vantagepoint A.I. Software which Power Traders use daily is the Daily Price Range prediction forecast.
This forecast is what permits Power Traders to truly fine tune their entries and exits into the market.
Here is the price chart of $AMD during the most recent two-month runup featuring the Daily Price Range forecast and the Neural Net Indicator.
Intermarket Analysis
What makes the Vantagepoint Software really extraordinary is its capacity to perform Intermarket analysis and to find those assets which are most statistically interconnected and are the key drivers of price.
Studying the charts can always provide objective realities in terms of locating support and resistance levels which become very clear on a chart. But we live in a global marketplace. Everything is interconnected. The billion-dollar question for traders is always what are the key drivers of price for the underlying asset that I am trading?
These intangibles are invisible to the naked eye yet show very high statistical correlations.
Small changes in Interest rates, Crude Oil Prices, and the Volatility of the dollar amongst thousands of other variables affect the decisions companies must make to survive in these very challenging times. Trying to determine what these factors are is one of the huge problems facing investors and traders.
There is great value to be had in studying and understanding the key drivers of $AMD price action.
By doing so you can often see which ETFs are most likely acquiring $AMD as well as uncovering other industries which affect $AMD price movement.
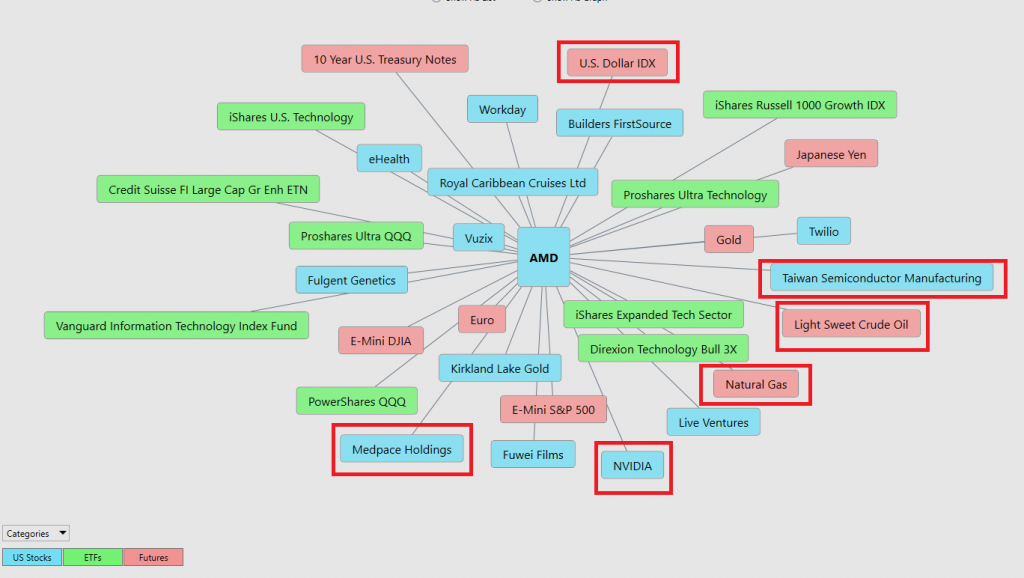
I have taken the liberty of highlighting a few of the stocks, futures and ETF’s which are most correlated to the price action we have seen in $AMD.
- U.S. Dollar Index
- Medpace Holdings
- NVIDIA
- Natural Gas
- Crude Oil
This can be invaluable information because it allows a trader to locate other opportunities and see a listing of the ETF’s that are also buyers of $AMD. This knowledge is how other trading opportunities are often uncovered in their embryonic stages.
Suggestion
$AMD has had an incredible run over the last two months. However, as we have shown in the WORST-case analysis the stock is extremely volatile and prone to 10% pullbacks very regularly.
This asset could go much higher but at the present time we would expect the stock to revert to a few % points below the value zone identified by the predictive blue line.
The trend is UP.
Momentum is UP.
The predictive blue line is the guidance that we will be following. Wall Street Analysts are slowly revising their estimates upward with the strong earnings that $AMD has posted over the last 5 quarters.
Our advice: Follow the a.i. trend analysis and practice good money management on all your trades. The chart looks very strong on $AMD.
We will re-evaluate this analysis based upon:
- Wall Street Analysts’ Estimates
- 52-week high and low boundaries
- Vantagepoint A.I. Forecast (Predictive Blue Line)
- Neural Network Forecast
- Daily Range Forecast
- Intermarket Analysis
Let’s Be Careful Out There!
Remember, It’s Not Magic.
It’s Machine Learning.

IMPORTANT NOTICE!
THERE IS SUBSTANTIAL RISK OF LOSS ASSOCIATED WITH TRADING. ONLY RISK CAPITAL SHOULD BE USED TO TRADE. TRADING STOCKS, FUTURES, OPTIONS, FOREX, AND ETFs IS NOT SUITABLE FOR EVERYONE.
DISCLAIMER: STOCKS, FUTURES, OPTIONS, ETFs AND CURRENCY TRADING ALL HAVE LARGE POTENTIAL REWARDS, BUT THEY ALSO HAVE LARGE POTENTIAL RISK. YOU MUST BE AWARE OF THE RISKS AND BE WILLING TO ACCEPT THEM IN ORDER TO INVEST IN THESE MARKETS. DON’T TRADE WITH MONEY YOU CAN’T AFFORD TO LOSE. THIS ARTICLE AND WEBSITE IS NEITHER A SOLICITATION NOR AN OFFER TO BUY/SELL FUTURES, OPTIONS, STOCKS, OR CURRENCIES. NO REPRESENTATION IS BEING MADE THAT ANY ACCOUNT WILL OR IS LIKELY TO ACHIEVE PROFITS OR LOSSES SIMILAR TO THOSE DISCUSSED ON THIS ARTICLE OR WEBSITE. THE PAST PERFORMANCE OF ANY TRADING SYSTEM OR METHODOLOGY IS NOT NECESSARILY INDICATIVE OF FUTURE RESULTS. CFTC RULE 4.41 – HYPOTHETICAL OR SIMULATED PERFORMANCE RESULTS HAVE CERTAIN LIMITATIONS. UNLIKE AN ACTUAL PERFORMANCE RECORD, SIMULATED RESULTS DO NOT REPRESENT ACTUAL TRADING. ALSO, SINCE THE TRADES HAVE NOT BEEN EXECUTED, THE RESULTS MAY HAVE UNDER-OR-OVER COMPENSATED FOR THE IMPACT, IF ANY, OF CERTAIN MARKET FACTORS, SUCH AS LACK OF LIQUIDITY. SIMULATED TRADING PROGRAMS IN GENERAL ARE ALSO SUBJECT TO THE FACT THAT THEY ARE DESIGNED WITH THE BENEFIT OF HINDSIGHT. NO REPRESENTATION IS BEING MADE THAT ANY ACCOUNT WILL OR IS LIKELY TO ACHIEVE PROFIT OR LOSSES SIMILAR TO THOSE SHOWN.

